Content
Published:
This is an archived release.
Population increase down
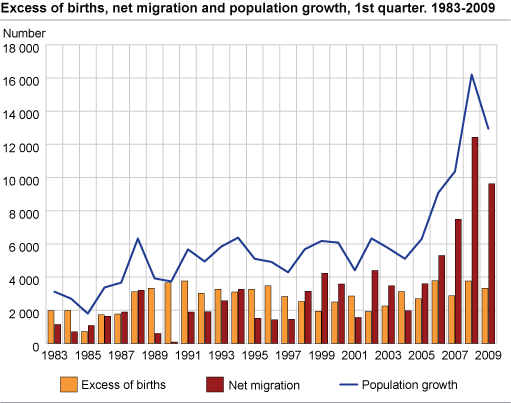
Norway's population increased by 13 000 to 4 812 000 in the first quarter of 2009. This increase is 21 per cent lower than in the first quarter of 2008, but is still the second largest population increase ever recorded in the first three months of a single year.
The immigration surplus from abroad in the first quarter, 9 600, made up 74 per cent of the increase. Immigration totalled 16 600 in the first quarter, 300 less than in the previous year. Emigration totalled 7 000, which is an increase from last year of 2 500 or 56 per cent.
A total of 14 800 children were born, the same as in 2008. A total of 11 000 died, resulting in an excess of births of 3 300, the same as in 2008.
Polish and German net immigration halved - but the Icelanders are coming
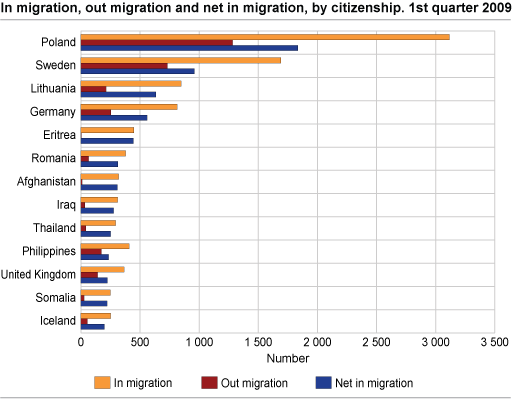
Some changes could be seen in the immigration pattern of the first three months. A total of 1 200 fewer Polish citizens came than the year before, and 1 000 more left, resulting in a decrease of the net immigration from 4 000 to 1 800. German citizens had a similar development; their net immigration fell from 1 000 to 600. Other larger groups, such as Swedish and Lithuanian citizens, saw their net immigration unchanged. For the first time, Icelandic citizens are among those with the largest net immigration; while it was 0 in 2008, it was 200 this year. Refugees from Eritrea increased their net immigration from 100 to 400, and Afghan citizens from 200 to 300. Those migrating to Norway had close to 150 different citizenships.
Population increase in all counties
Oslo had the highest population growth with 3 400. The four counties Oslo, Akershus, Rogaland and Hordaland represented 8 400 or 65 per cent of the total population increase in the country. In three of the counties - Hedmark, Sogn og Fjordane and Finnmark - population growth was less than 40.
Highest natural increase in Oslo
Oslo stood out as regards excess of births over deaths, which reached 1 300 or almost 40 per cent of the total excess of births in the country. Four counties had a deficit of births over deaths.
Migration gain from abroad
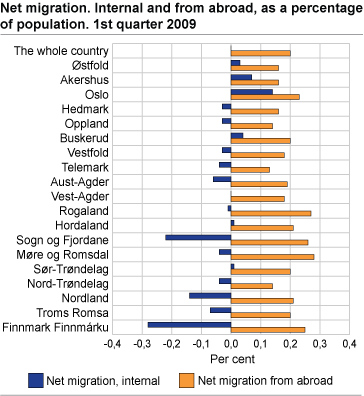
As in previous years, all 19 counties had a migration gain from abroad. Oslo and Rogaland had the largest gain with 1 300 and 1 100 respectively. The migration gain totalled 9 600 and offset the birth deficit and domestic migration loss in many counties.
Twelve counties had a domestic migration loss, whereas six had a domestic migration gain, the largest of which was in Oslo.
Population increase in 240 municipalities
A total of 240 municipalities had a population increase in the first quarter, whereas 180 had a decrease. As in previous years, the population increased in centrally situated municipalities whereas less central areas experienced migration loss and birth deficit. A total of 29 of the 50 municipalities with the largest population decrease were situated in the three counties in Northern Norway. Half of the 10 municipalities with the largest birth deficit were situated in Hedmark.
| Total migration gain (256 in all) | Domestic migration gain (141 in all) | Migration gain from abroad (366 in all) | |||||||||||||||||||||||||||||||||||||
|---|---|---|---|---|---|---|---|---|---|---|---|---|---|---|---|---|---|---|---|---|---|---|---|---|---|---|---|---|---|---|---|---|---|---|---|---|---|---|---|
| 1 | Oslo | 2 111 | 1 Oslo | 791 | 1 Oslo | 1 320 | |||||||||||||||||||||||||||||||||
| 2 | Bergen | 593 | 2 Bergen | 214 | 2 Stavanger | 437 | |||||||||||||||||||||||||||||||||
| 3 | Trondheim | 513 | 3 Trondheim | 152 | 3 Bergen | 379 | |||||||||||||||||||||||||||||||||
| 4 | Stavanger | 352 | 4 Sola | 121 | 4 Trondheim | 361 | |||||||||||||||||||||||||||||||||
| 5 | Bærum | 248 | 5 Tromsø | 81 | 5 Sandnes | 231 | |||||||||||||||||||||||||||||||||
| 6 | Sandnes | 241 | 6 Ullensaker | 80 | 6 Bærum | 170 | |||||||||||||||||||||||||||||||||
| 7 | Drammen | 215 | 7 Bærum | 78 | 7 Drammen | 144 | |||||||||||||||||||||||||||||||||
| 8 | Kristiansand | 203 | 8 Nittedal | 78 | 8 Fredrikstad | 143 | |||||||||||||||||||||||||||||||||
| 9 | Sola | 182 | 9 øvre Eiker | 75 | 9 Kristiansand | 135 | |||||||||||||||||||||||||||||||||
| 10 | Tromsø | 161 | 10 Stange | 73 | 10 ålesund | 126 | |||||||||||||||||||||||||||||||||
| Total migration loss (153 in all) | Domestic migration loss (273 in all) | Migration loss to abroad (32 in all) | |||||||||||||||||||||||||||||||||||||
|---|---|---|---|---|---|---|---|---|---|---|---|---|---|---|---|---|---|---|---|---|---|---|---|---|---|---|---|---|---|---|---|---|---|---|---|---|---|---|---|
| 1 | Malvik | -33 | 1 Asker | -125 | 1 Bø | -9 | |||||||||||||||||||||||||||||||||
| 2 | Karmøy | -33 | 2 Stavanger | -85 | 2 Orkdal | -5 | |||||||||||||||||||||||||||||||||
| 3 | Farsund | -33 | 3 Karmøy | -65 | 3 Malvik | -4 | |||||||||||||||||||||||||||||||||
| 4 | Bø | -33 | 4 Farsund | -50 | 4 Fyresdal | -3 | |||||||||||||||||||||||||||||||||
| 5 | Karlsøy | -31 | 5 Ski | -43 | 5 Modalen | -3 | |||||||||||||||||||||||||||||||||
| 6 | Høyanger | -31 | 6 Nesodden | -41 | 6 Hurdal | -3 | |||||||||||||||||||||||||||||||||
| 7 | Risør | -30 | 7 Voss | -41 | 7 10 municipalities | -2 | |||||||||||||||||||||||||||||||||
| 8 | Selje | -27 | 8 Røyken | -39 | 8 16 minicipalities | -1 | |||||||||||||||||||||||||||||||||
| 9 | Røyken | -27 | 9 Førde | -39 | |||||||||||||||||||||||||||||||||||
| 10 | Inderøy/Hemne | -26 | 10 Risør/Kongsvinger | -38 | |||||||||||||||||||||||||||||||||||
| Excess of births (193 in all) |
Excess of births in relation to population/
1 000 (193 in all)(Norway = 0.70) |
Population growth (240 in all) |
Population growth in relation to population/
1 000 (240 in all)(Norway = 2.70) |
||||||||||||||||||||||||||||||||||||
|---|---|---|---|---|---|---|---|---|---|---|---|---|---|---|---|---|---|---|---|---|---|---|---|---|---|---|---|---|---|---|---|---|---|---|---|---|---|---|---|
| 1 | Oslo | 1 284 | 1 Gjerdrum | 4,0 | 1 Oslo | 3 395 | 1 Træna | 54,9 | |||||||||||||||||||||||||||||||
| 2 | Bergen | 274 | 2 Bokn | 3,7 | 2 Bergen | 867 | 2 Austrheim | 24,1 | |||||||||||||||||||||||||||||||
| 3 | Trondheim | 218 | 3 Audnedal | 3,7 | 3 Trondheim | 731 | 3 Nesna | 17,9 | |||||||||||||||||||||||||||||||
| 4 | Stavanger | 200 | 4 Hå | 3,6 | 4 Stavanger | 552 | 4 Ulstein | 15,7 | |||||||||||||||||||||||||||||||
| 5 | Sandnes | 143 | 5 Leka | 3,4 | 5 Sandnes | 384 | 5 Sund | 14,2 | |||||||||||||||||||||||||||||||
| 6 | Bærum | 100 | 6 Klepp | 3,4 | 6 Bærum | 348 | 6 Gjerdrum | 13,7 | |||||||||||||||||||||||||||||||
| 7 | Kristiansand | 98 | 7 Froland | 3,3 | 7 Kristiansand | 301 | 7 Værøy | 12,2 | |||||||||||||||||||||||||||||||
| 8 | Tromsø | 98 | 8 Sogndalen | 3,1 | 8 Tromsø | 259 | 8 Sirdal | 12,1 | |||||||||||||||||||||||||||||||
| 9 | Bodø | 94 | 9 Tysvær | 3,0 | 9 Sola | 230 | 9 Audnedal | 11,0 | |||||||||||||||||||||||||||||||
| 10 | Askøy | 70 | 10 Alta | 3,0 | 10 Drammen | 223 | 10 Eidfjord | 10,6 | |||||||||||||||||||||||||||||||
| Birth deficit (209 in all) |
Birth deficit in relation to population/
1 000 (209 in all)(Norway = 0.70) |
Population decrease (180 in all) |
Population decrease in relation to population/
1 000 (180 in all)(Norway = 2.70) |
||||||||||||||||||||||||||||||||||||
|---|---|---|---|---|---|---|---|---|---|---|---|---|---|---|---|---|---|---|---|---|---|---|---|---|---|---|---|---|---|---|---|---|---|---|---|---|---|---|---|
| 1 | Kongsvinger | -33 | 1 Ibestad | -8,3 | 1 Kongsvinger | -58 | 1 Gamvik | -18,5 | |||||||||||||||||||||||||||||||
| 2 | Grue | -28 | 2 Jondal | -5,9 | 2 Høyanger | -35 | 2 Ibestad | -16,7 | |||||||||||||||||||||||||||||||
| 3 | åsnes | -27 | 3 Grue | -5,5 | 3 Risør | -33 | 3 Måsøy | -15,3 | |||||||||||||||||||||||||||||||
| 4 | Sandefjord | -25 | 4 Torsken | -5,5 | 4 Bø (Nordland) | -32 | 4 Berg | -13,8 | |||||||||||||||||||||||||||||||
| 5 | Gran | -24 | 5 Tysfjord | -5,4 | 5 Selje | -31 | 5 Karlsøy | -12,6 | |||||||||||||||||||||||||||||||
| 6 | Porsgrunn | -24 | 6 Berg | -5,3 | 6 Karlsøy | -30 | 6 Beiarn | -12,3 | |||||||||||||||||||||||||||||||
| 7 | Notodden | -23 | 7 Evenes | -5,2 | 7 Bø (Telemark) | -30 | 7 Båtsfjord | -12,1 | |||||||||||||||||||||||||||||||
| 8 | Odda | -22 | 8 Salangen | -5,0 | 8 Farsund | -30 | 8 Fedje | -11,7 | |||||||||||||||||||||||||||||||
| 9 | Elverum | -20 | 9 Rollag | -4,9 | 9 Aure | -28 | 9 Bø (Nordland) | -11,3 | |||||||||||||||||||||||||||||||
| 10 | Stange | -20 | 10 Osen | -4,9 | 10 Eidskog | -27 | 10 Tjeldsund | -11,3 | |||||||||||||||||||||||||||||||
The statistics is published with Population.
Contact
-
Statistics Norway's Information Centre
E-mail: informasjon@ssb.no
tel.: (+47) 21 09 46 42


