Content
Published:
This is an archived release.
Another population increase record
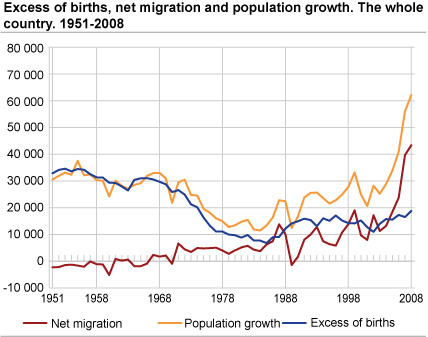
Norway's population increased by 62 100 to 4 799 300 in 2008. This is by far the highest annual increase ever recorded and 6 000 higher than in 2007, the year with the largest growth until now.
The relative population increase was 1.3 per cent in 2008, the highest increase since 1920. Since 1900, 1920 was the only year with a higher relative increase than 2008.
Immigration totalled 67 000 in 2008, which is the highest figure ever recorded and 9.5 per cent higher than in the previous year. Emigration increased by 7 per cent or 1 500, totalling 23 600. Births totalled 60 500 in 2008 and total deaths was 41 700.
|
The population as at 1 January 2009 is published by sex and age. Figures for municipalities, counties and the country as a whole, distributed by one-year age groups and sex, are available in StatBank Norway. Furthermore, tables containing figures by sex and different age groups for municipalities, counties and the country as a whole are available at http://www.ssb.no/folkemengde_en/ . More data will be published on 12 March. The total numbers for births, deaths and migrations in 2008 are available for municipalities, counties and the whole country. Figures for migration by citizenship are available on request. More detailed statistics on deaths, births, internal migrations, and immigration and emigration will be published on 2 April, 16 April and 7 May respectively. Figures are now published for marriages, divorces and separations for counties and the whole country. More detailed information on these topics will be available in August. |
18 800 more births than deaths - total fertility rate at 1.96 - life expectancy increases
Last year, 60 500 children were born in Norway and 41 700 persons died. Since 1973, the number of children born has been higher only in 1990, 1991 and 1996. Not since around 1980 has the number of deaths been lower than during the period 2004-2008.
The total fertility rate for 2008 was 1.96. This is among the highest in Europe. A boy born in 2008 can expect a life duration of 78.31 years, and a girl can expect 82.95 years. Both are slightly up from 2007, and high compared to Europe.
Poles still largest group of immigrants
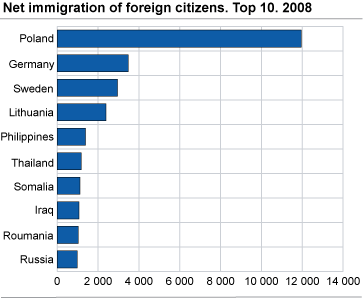
Compared to 2007, net immigration surplus increased by 3 700 to 43 300. Polish citizens contributed most to the surplus, with 12 000 more immigrations than emigrations last year. They were followed by Germans, Swedes and Lithuanians, each contributing with between 3 500 and 2 400 more immigrations than emigrations. In total, 14 200 Polish citizens migrated to Norway last year, compared to 600 in 2003. Migrants to or from Norway in 2008 had 175 different citizenships.
Highest natural increase in Oslo
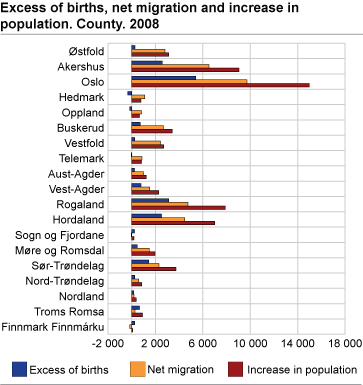
As in later years, there was an excess of births over deaths in all counties except Hedmark, Oppland and Telemark. The highest natural increase took place in Oslo, with 5 400 more births than deaths.
Oslo, Akershus, Rogaland and Hordaland had the largest population increase in 2008, with 63 per cent of the total national increase. A total of 23 per cent of Norway’s population now live in Oslo and Akershus, while 18.5 per cent live in Rogaland and Hordaland.
Migration gain from abroad
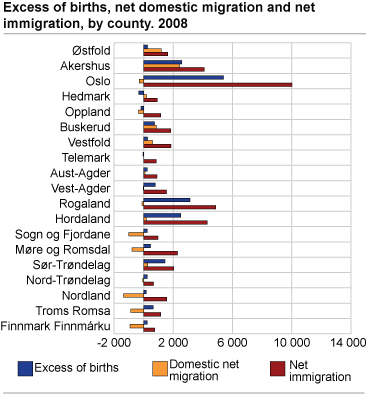
As in previous years, all 19 counties had a migration gain from abroad. Oslo had the largest gain with 10 000. The migration gain totalled 43 300 and offset the birth deficit and domestic migration loss in many counties.
Population increase in 269 municipalities
A total of 269 municipalities had a population increase in 2008, whereas 156 had a decrease. In 2007, 259 municipalities had an increase. Of the 33 municipalities with a decrease of 1.5 per cent or more, 21 were situated in Northern Norway. As in previous years, the centrally situated municipalities had a population increase, whereas the less central areas had a migration loss as well as a birth deficit.
| Total migration gain (288 in all) | Domestic migration gain (152 in all) | Migration gain from abroad (420 in all) | |||||||||||||||||||||||||||||||||||||
|---|---|---|---|---|---|---|---|---|---|---|---|---|---|---|---|---|---|---|---|---|---|---|---|---|---|---|---|---|---|---|---|---|---|---|---|---|---|---|---|
| 1 | Oslo | 9 732 | Ullensaker | 768 | Oslo | 10 023 | |||||||||||||||||||||||||||||||||
| 2 | Bergen | 2 862 | Trondheim | 622 | Bergen | 2 515 | |||||||||||||||||||||||||||||||||
| 3 | Trondheim | 1 829 | Drammen | 600 | Stavanger | 1 686 | |||||||||||||||||||||||||||||||||
| 4 | Stavanger | 1 108 | Sørum | 387 | Trondheim | 1 207 | |||||||||||||||||||||||||||||||||
| 5 | Bærum | 1 084 | Bergen | 347 | Bærum | 987 | |||||||||||||||||||||||||||||||||
| 6 | Drammen | 1 007 | Fredrikstad | 336 | Sandnes | 789 | |||||||||||||||||||||||||||||||||
| 7 | Ullensaker | 978 | Røyken | 300 | Kristiansand | 753 | |||||||||||||||||||||||||||||||||
| 8 | Fredrikstad | 775 | Skien | 257 | Tromsø | 561 | |||||||||||||||||||||||||||||||||
| 9 | Kristiansand | 760 | Askøy | 254 | Asker | 538 | |||||||||||||||||||||||||||||||||
| 10 | Sandnes | 758 | ås | 211 | Haugesund | 461 | |||||||||||||||||||||||||||||||||
| Total migration loss (139 in all) | Domestic migration loss (271 in all) | Migration loss to abroad (5 in all) | |||||||||||||||||||||||||||||||||||||
| 1 | Målselv | -120 | Stavanger | -578 | Vefsn | -23 | |||||||||||||||||||||||||||||||||
| 2 | Vefsn | -98 | Oslo | -291 | Hjartdal | -4 | |||||||||||||||||||||||||||||||||
| 3 | Kárájohka Karasjok | -79 | Narvik | -192 | Skaun | -4 | |||||||||||||||||||||||||||||||||
| 4 | Lunner | -73 | Flora | -174 | Snåsa | -1 | |||||||||||||||||||||||||||||||||
| 5 | Narvik | -68 | Bodø | -169 | Nordreisa | -1 | |||||||||||||||||||||||||||||||||
| 6 | Eide | -63 | Alta | -139 | |||||||||||||||||||||||||||||||||||
| 7 | Ullensvang | -61 | Målselv | -137 | |||||||||||||||||||||||||||||||||||
| 8 | Gulen | -56 | ål | -133 | |||||||||||||||||||||||||||||||||||
| 9 | Kvalsund | -49 | Harstad | -130 | |||||||||||||||||||||||||||||||||||
| 10 | Lyngen | -48 | Hammerfest | -128 | |||||||||||||||||||||||||||||||||||
|
Excess of births
(213 in total) |
Excess of births in
relation to population/ 1 000 (213 in total) (Norway = 3.97) |
Population growth
(269 in total) |
Population growth in
relation to population/ 1 000 (269 in total) (Norway = 13.1) |
||||||||||||||||||||||||||||||||||||
|---|---|---|---|---|---|---|---|---|---|---|---|---|---|---|---|---|---|---|---|---|---|---|---|---|---|---|---|---|---|---|---|---|---|---|---|---|---|---|---|
| 1 | Oslo | 5 395 | Unjárga Nesseby | 11.7 | Oslo | 14 991 | Bykle | 50.1 | |||||||||||||||||||||||||||||||
| 2 | Bergen | 1 416 | Hå | 11.6 | Bergen | 4 305 | Sørum | 46.4 | |||||||||||||||||||||||||||||||
| 3 | Trondheim | 1 233 | Time | 11.6 | Trondheim | 3 066 | Ullensaker | 44.7 | |||||||||||||||||||||||||||||||
| 4 | Stavanger | 948 | Skodje | 11.5 | Stavanger | 2 024 | Hole | 42.5 | |||||||||||||||||||||||||||||||
| 5 | Tromsø | 661 | Stordal | 11.2 | Bærum | 1 556 | Skodje | 40.3 | |||||||||||||||||||||||||||||||
| 6 | Sandnes | 638 | Førde | 11.0 | Sandnes | 1 394 | Våler i østfold | 39.6 | |||||||||||||||||||||||||||||||
| 7 | Bærum | 479 | Gjesdal | 10.4 | Drammen | 1 260 | Meland | 39.3 | |||||||||||||||||||||||||||||||
| 8 | Kristiansand | 439 | Askøy | 10.3 | Tromsø | 1 227 | Flå | 38.0 | |||||||||||||||||||||||||||||||
| 9 | Bodø | 360 | Fjell | 10.3 | Ullensaker | 1 204 | Søgne | 36.5 | |||||||||||||||||||||||||||||||
| 10 | Drammen | 261 | Sandnes | 10.3 | Kristiansand | 1 190 | ås | 35.2 | |||||||||||||||||||||||||||||||
|
Birth deficit
(208 in total) |
Birth deficit in
relation to population/ 1 000 (208 in total) |
Population decrease
(156 in total) |
Population decrease in
relation to population/ 1 000 (156 in total) |
||||||||||||||||||||||||||||||||||||
| 1 | Eidskog | -66 | Bjarkøy | -23.6 | Målselv | -113 | Kvalsund | -51.8 | |||||||||||||||||||||||||||||||
| 2 | Grue | -54 | Ibestad | -17.9 | Vefsn | -82 | Ibestad | -47.0 | |||||||||||||||||||||||||||||||
| 3 | østre Toten | -49 | Utsira | -14.2 | Kárájohka Karasjok | -80 | Snillfjord | -33.3 | |||||||||||||||||||||||||||||||
| 4 | åsnes | -45 | Rømskog | -13.9 | Gulen | -73 | Mosvik | -32.4 | |||||||||||||||||||||||||||||||
| 5 | Gran | -43 | Loppa | -12.7 | Ibestad | -71 | Gulen | -31.0 | |||||||||||||||||||||||||||||||
| 6 | Hamar | -38 | Fosnes | -11.6 | Ullensvang | -64 | Hasvik | -28.1 | |||||||||||||||||||||||||||||||
| 7 | Ringebu | -34 | Lierne | -11.5 | Bjugn | -64 | Kárájohka Karasjok | -27.9 | |||||||||||||||||||||||||||||||
| 8 | Våler i Hedmark | -33 | Modalen | -11.1 | Porsanger Porsángu Porsanki | -59 | Tranøy | -26.6 | |||||||||||||||||||||||||||||||
| 9 | Surnadal | -31 | Halsa | -10.8 | Røros | -57 | Røst | -25.7 | |||||||||||||||||||||||||||||||
| 10 | Kongsvinger | -30 | Grue | -10.6 | Kvalsund | -57 | Valle | -25.6 | |||||||||||||||||||||||||||||||
The statistics is published with Population.
Contact
-
Statistics Norway's Information Centre
E-mail: informasjon@ssb.no
tel.: (+47) 21 09 46 42


