Content
Published:
This is an archived release.
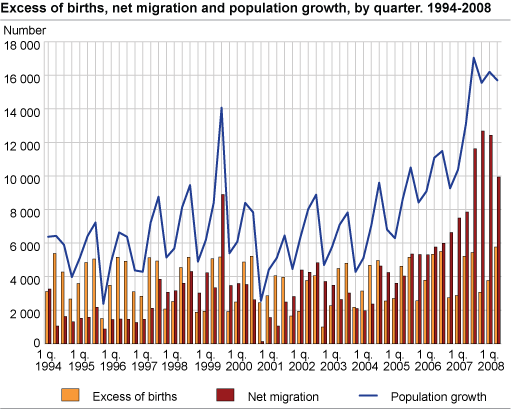
Third highest population increase ever
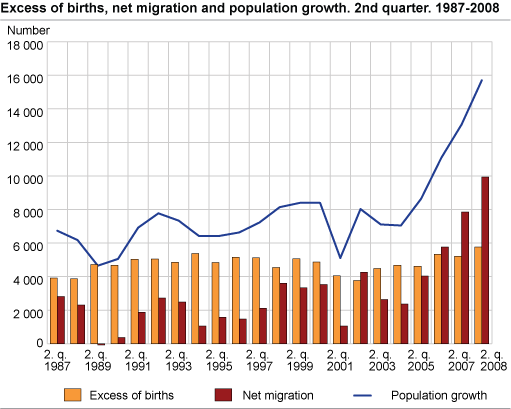
In the second quarter of 2008, Norway’s population increased by 15 700. More than 60 per cent of the growth resulted from inward migration. Not since 1970 has the birth surplus been higher.
Population reached 4 769 100 on 1 July. The population increase of 15 700 is the third highest ever registered in a single quarter. Only the third quarter 2007 and first quarter 2008 showed a higher increase.
15 500 persons migrated to Norway and 5 600 left during this period, resulting in a net inward migration of 9 900. In the first quarter, the net inward migration was at 12 400. The reason for the decrease, was that the number of immigrants was 1400 lower than in the first quarter, while the number of emigrants was 1 100 higher.
Polish citizens dominate among immigrants
Of the 13 600 immigrants without Norwegian citizenship arriving in the second quarter, 69 per cent were Europeans. Polish citizens dominated, the net inward migration of Polish citizens was at 3 100 in the second quarter, 7 100 in the first half year of 2008. Polish citizens constituted one third of the net inward migration of foreign citizens. Other larger groups were German and Lithuanian citizens.
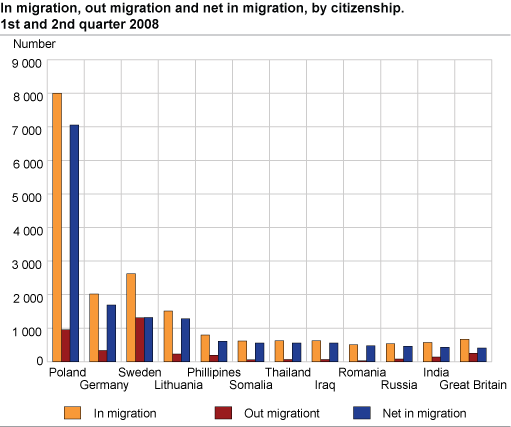
In total, 1 300 fewer Polish, German and Swedish citizens migrated to Norway in the second quarter than in the first, whereas twice as many Polish and Lithuanian citizens left in the second quarter compared to the first, 800 towards 400.
Many children born
15 900 children were born in the second quarter, 600 more than last year. Not since 1995 have the figures been higher.
11 100 persons died, 100 persons more than the corresponding period last year. The birth surplus reached 5 800 persons, 11 per cent higher than in the same quarter 2007. Norway has not seen a higher surplus since around 1970. Oslo had the highest birth surplus, and only two counties saw a birth deficit.
In the first half year of 2008, 30 600 children were born, 1 100 more than the previous year. The number of deaths, 21 100, is 400 smaller that the corresponding figure for 2007, resulting in a birth surplus of 9 500, 18 per cent higher than the first half year of 2007.
Largest population growth in central areas
36 per cent of the population growth took place in Akershus and Oslo, and 24 per cent in Rogaland and Hordaland. None of the counties experienced a population deficit.
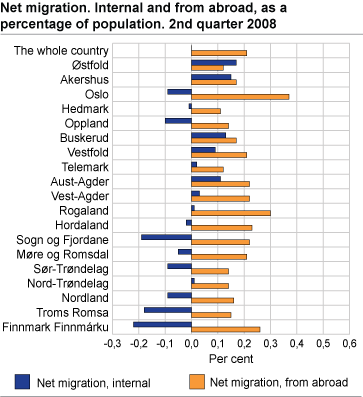
Largest domestic migrations loss in the capital in the second quarter
All counties had an inward migration surplus from abroad, with Oslo having the highest figure (2 250). Nine counties had a domestic migrations surplus, with Akershus having the highest figure (780). Ten counties had a domestic migrations deficit, Oslo having the highest (510).
In the first half of 2008, Oslo had the highest inward migration surplus from abroad (5 510). Eight counties had a domestic migration surplus, with Akershus having the highest figure (1 160). Eleven counties had a domestic migration deficit, Nordland having the highest (580).
Population growth in 269 municipalities in the first half of 2008
In 269 municipalities the population increased in the first half of 2008, whereas it decreased in 157 municipalities. Apart from the four largest cities, Bærum had the biggest population growth (820). As has been the case in later years, centralised municipalities experience a population increase, while less centralised areas are more likely to see a migration loss as well as a birth deficit.
Birth deficit in many inland municipalities
A total of 222 municipalities saw a birth surplus, whereas 199 experienced a birth deficit. Of the 20 municipalities with the largest birth deficit, 11 were situated in the inland counties Hedmark and Oppland.
| Total migration gain (286 in total) | Domestic migration gain (149 in total) | Migration gain from abroad (396 in total) | |||||||||||||||||||||||||||||||||||||
|---|---|---|---|---|---|---|---|---|---|---|---|---|---|---|---|---|---|---|---|---|---|---|---|---|---|---|---|---|---|---|---|---|---|---|---|---|---|---|---|
| 1 Oslo | 5 593 | Ullensaker | 456 | Oslo | 5 505 | ||||||||||||||||||||||||||||||||||
| 2 Bergen | 1 128 | Drammen | 386 | Bergen | 1 122 | ||||||||||||||||||||||||||||||||||
| 3 Trondheim | 870 | Trondheim | 335 | Stavanger | 954 | ||||||||||||||||||||||||||||||||||
| 4 Stavanger | 731 | Fredrikstad | 220 | Bærum | 567 | ||||||||||||||||||||||||||||||||||
| 5 Bærum | 615 | Røyken | 180 | Trondheim | 535 | ||||||||||||||||||||||||||||||||||
| 6 Drammen | 599 | Sørum | 161 | Sandnes | 477 | ||||||||||||||||||||||||||||||||||
| 7 Ullensaker | 548 | Askøy | 154 | Kristiansand | 324 | ||||||||||||||||||||||||||||||||||
| 8 Sandnes | 459 | Skien | 139 | Asker | 303 | ||||||||||||||||||||||||||||||||||
| 9 Fredrikstad | 404 | Klepp | 137 | Tromsø | 279 | ||||||||||||||||||||||||||||||||||
| 10 Tromsø | 394 | Tromsø | 115 | Haugesund | 219 | ||||||||||||||||||||||||||||||||||
| Total migration loss (138 in total) | Domestic migration loss (271 in total) | Migration loss to abroad (16 in total) | |||||||||||||||||||||||||||||||||||||
| 1 Målselv | -72 | Stavanger | -223 | Vefsn | -48 | ||||||||||||||||||||||||||||||||||
| 2 Vefsn | -68 | Skedsmo | -163 | Bø (Telemark) | -19 | ||||||||||||||||||||||||||||||||||
| 3 Bø (Telemark) | -56 | Bodø | -111 | Dønna | -3 | ||||||||||||||||||||||||||||||||||
| 4 Karasjohka-Karasjok | -47 | Narvik | -98 | Træna | -2 | ||||||||||||||||||||||||||||||||||
| 5 Bjugn | -44 | Hadsel | -88 | Hjartdal | -2 | ||||||||||||||||||||||||||||||||||
| 6 Lunner | -42 | Lenvik | -84 | Tydal | -2 | ||||||||||||||||||||||||||||||||||
| 7 Bodø | -42 | Lillehammer | -77 | Grane | -2 | ||||||||||||||||||||||||||||||||||
| 8 Fjaler | -36 | Flora | -72 | Målselv | -2 | ||||||||||||||||||||||||||||||||||
| 9 åmot | -36 | Lier | -72 | Karasjohka-Karasjok | -2 | ||||||||||||||||||||||||||||||||||
| 10 Bardu | -36 | Bardu | -71 | Fjaler | -2 | ||||||||||||||||||||||||||||||||||
| Excess of births (222 in total) | Excess of births in relation to population / 1000 (222 in total) | Population growth (269 in total) | Population growth in relation to population / 1000 (269 in total) | ||||||||||||||||||||||||||||||||||||
|---|---|---|---|---|---|---|---|---|---|---|---|---|---|---|---|---|---|---|---|---|---|---|---|---|---|---|---|---|---|---|---|---|---|---|---|---|---|---|---|
| 1 Oslo | 2 732 | Skodje | 7,7 | Oslo | 8 325 | Flå | 37,0 | ||||||||||||||||||||||||||||||||
| 2 Bergen | 653 | Enebakk | 6,8 | Bergen | 1 781 | Skodje | 24,8 | ||||||||||||||||||||||||||||||||
| 3 Trondheim | 647 | Stordal | 6,1 | Trondheim | 1 517 | Ullensaker | 24,7 | ||||||||||||||||||||||||||||||||
| 4 Stavanger | 481 | Fjell | 5,8 | Stavanger | 1 212 | Hole | 23,5 | ||||||||||||||||||||||||||||||||
| 5 Sandnes | 336 | Time | 5,7 | Bærum | 823 | Meland | 22,8 | ||||||||||||||||||||||||||||||||
| 6 Tromsø | 323 | Klepp | 5,5 | Sandnes | 795 | Lebesby | 22,2 | ||||||||||||||||||||||||||||||||
| 7 Kristiansand | 228 | Gjesdal | 5,4 | Drammen | 733 | Våler (østfold) | 20,6 | ||||||||||||||||||||||||||||||||
| 8 Bærum | 208 | Sandnes | 5,4 | Tromsø | 717 | Sørum | 20,6 | ||||||||||||||||||||||||||||||||
| 9 Bodø | 156 | Klæbu | 5,0 | Ullensaker | 664 | Klepp | 19,9 | ||||||||||||||||||||||||||||||||
| 10 Skedsmo | 148 | Sola | 5,0 | Kristiansand | 579 | Finnøy | 19,5 | ||||||||||||||||||||||||||||||||
| Birth deficit (199 in total) | Birth deficit in relation to population / 1000 (199 in total) | Population decrease (157 in total) | Population decrease in relation to population / 1000 (157 in total) | ||||||||||||||||||||||||||||||||||||
| 1 Eidskog | -25 | Bjarkøy | -11,8 | Målselv | -71 | Kvalsund | -27,2 | ||||||||||||||||||||||||||||||||
| 2 Grue | -24 | Utsira | -9,4 | Vefsn | -65 | Værøy | -20,2 | ||||||||||||||||||||||||||||||||
| 3 østre Toten | -24 | Rømskog | -9,2 | Bjugn | -57 | Agdenes | -19,3 | ||||||||||||||||||||||||||||||||
| 4 Hamar | -24 | Fosnes | -8,7 | Bø (Telemark) | -49 | Hamarøy | -18,2 | ||||||||||||||||||||||||||||||||
| 5 Ringerike | -23 | Fedje | -8,4 | Karasjohka-Karasjok | -48 | Ibestad | -17,9 | ||||||||||||||||||||||||||||||||
| 6 Stange | -21 | Ibestad | -7,9 | Fjaler | -45 | Rendalen | -17,7 | ||||||||||||||||||||||||||||||||
| 7 Ringebu | -20 | Rendalen | -7,4 | Gulen | -38 | Mosvik | -17,4 | ||||||||||||||||||||||||||||||||
| 8 Våler (Hedmark) | -19 | Granvin | -7,3 | Rendalen | -36 | Fedje | -16,8 | ||||||||||||||||||||||||||||||||
| 9 Surnadal | -19 | Lierne | -6,8 | Agdenes | -34 | Karasjohka-Karasjok | -16,7 | ||||||||||||||||||||||||||||||||
| 10 Nord-Odal / Selbu | -17 | Værøy | -6,7 | Lødingen | -34 | Gulen | -16,1 | ||||||||||||||||||||||||||||||||
The statistics is published with Population.
Contact
-
Statistics Norway's Information Centre
E-mail: informasjon@ssb.no
tel.: (+47) 21 09 46 42