Content
Published:
This is an archived release.
Record high internal migration
Around 4.5 per cent of the population migrated across municipal boundaries last year. The figure for migrations between municipalities was 201 000 in 2000. This was an increase of 9 400 since 1999 and the highest ever recorded in a normal year.
The geographical mobility - measured as migration in relation to the population - has also increased. We have to go as far back as 1977 to find a higher mobility for the population at large. The increase in the mobility has been larger for males than for females, and since 1987 the male mobility has been higher than that of the females. For migrations between counties it is only as far back as 1981 that one can find similar high mobility as in the year 2000. Mobility between regions increased slightly in 2000 in relation to 1999, but mobility was higher in 1997-1998, 1985-1986 and 1965-1982.
With regards to migration between municipalities, five-year age groups up till the age of 50 have experienced an increased geographical mobility from 1999 to 2000, the smallest for young adults. The increase has been the same for both males and females. It is important to take into consideration the composition of the population and the changes in the number of municipalities when migration is compared over time. It is equally important to take note that in some particular years, there can be a larger or smaller under-registration of migration.
Out-migration from Oslo to the rest of the country
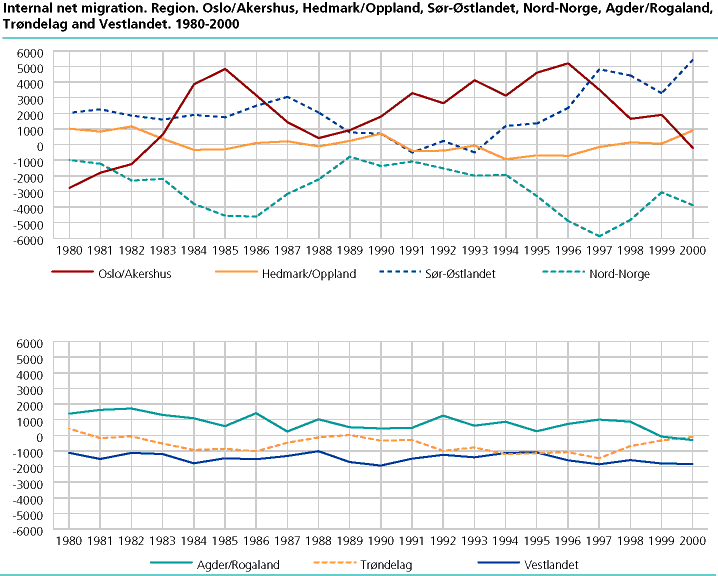
After a near migration balance in 1999, Oslo had a net migration loss of 1 900 to the rest of the country in 2000. Oslo had a net in-migration from the rest of the country in the years 1990-1997, beyond that a net out-migration after 1960. Oslo and Akershus together had a net migration loss to the rest of the counties in 2000, for the first time since 1982. Nordland, Troms and Finnmark had a net out-migration of almost 4 000 to the rest of the country, an increase of 800 from 1999. It is only during the years with the highest level of out-migration (1985-1986 and 1995-1998) that higher losses were recorded. Østfold had a net gain in internal migration of 2 400 in 2000. With the exception of Oslo, all the counties in Eastern Norway and the Agder counties recorded net gains in internal migration. All the other counties except Hordaland and Sør-Trøndelag experienced a net loss in internal migration.
Fewer immigrated from abroad
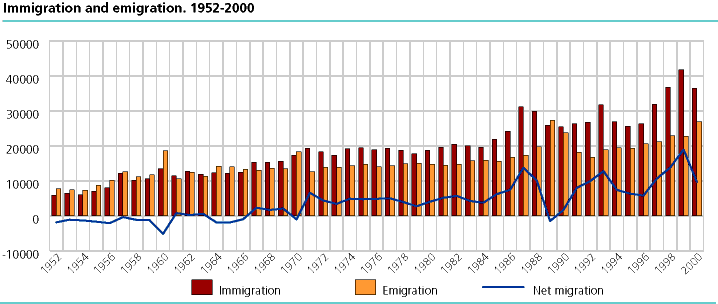
In 2000, 36 500 persons immigrated to Norway, while 26 900 emigrated. The net immigration of 9 700 is lower than in the previous year by 9 300. Immigration was reduced by 5 300, whilst emigration increased by 4 000.
The net gain in migration from abroad declined by 1 900 in Oslo and 1 200 in Akershus. The net immigration to Oslo and Akershus in 2000 was 1 100, the lowest since 1979. The net immigration to Northern Norway in 2000 was 2 200 as against 3 000 in 1999. The net immigration to Northern Norway makes up for the net internal out-migration to some extent, in the 1990s the net immigration made up for half the figure on net internal out-migration. With the exception of Rogaland, all counties recorded net gains in migration from abroad in 2000.
Oslo had the largest proportion of net gains in migration from abroad in 1999, while in 2000 Hordaland and Nordland had the largest proportion of immigrants from abroad with 11 per cent each.
Migration balance with Sweden, Yugoslavia and Iraq has changed
Immigrations from Sweden declined by 1 000 from 1999 to 2000, while emigrations rose by 1 000 in the same period. Norway recorded a net emigration loss of 1 500 to Sweden in 2000, after net gains in migration since 1991 with a peak of 4 000 in 1997.
In 1999, 6 400 Yugoslavs immigrated into Norway. These were mainly Kosovo Albanians who were given collective temporal protection permits in Norway because of the conflict in Kosovo. Immigration from Yugoslavia declined by 5 400 in 2000, while 600 more persons moved back to Yugoslavia.
Immigration from Asia increased by 2 400. The entire increase is due to immigration from Iraq. The increase in the number of immigrants from Iraq is due to an influx of asylum seekers, especially Kurds from the Kurdish self-governed area in Iraq. For the larger number of asylum seekers the year of arrival was 1999, but they got temporal resident permits and were included only in the 2000 statistics. There were only minor changes for the other countries in Asia, and in Africa and America.
More Norwegians migrate to Sweden
While 8 800 Norwegian citizens moved to Norway, 11 900 moved out. The net emigration of Norwegian citizens rose by 2 600 from 1999 to 2000. There was net emigration to Sweden between 1982 and 1991, at a high in 1989 with 7 000 persons. Between 1992 and 1998 there was a net immigration of Norwegians from Sweden. The trend changed again in 1999, and more Norwegians now migrate to than from Sweden (1 400 in 2000).
355 000 migrations within municipalities
In addition to the 201 000 migrations between municipalities in 2000, 355 000 migrations were registered within municipalities, an increase of 5 000 migrations from 1999. Within Oslo there were 60 400 registered migrations, approximately the same as in 1999. This was slightly lower than the total number of migrations in and out of the municipality.
Scope of the statistics
The statistics for 2000 cover mainly migrations that actually took place and were registered in 2000. Migrations from the previous year are included in the 2000 figures on condition that the migration updated the Central Population Registry in the period between 1 March 2000 and 28 February 2001. 1 811 such cases were registered; last year the figure was 1 420.
Tables:
- Table 1 Internal migration. 1951-2000
- Table 2 Immigration and emigration. 1951-2000
- Table 3 All migration. Internal and immigration/emigration, by county. 1966-2000
- Table 4 Internal migration. County. 1966-2000
- Table 5 Immigration/emigration, by county. 1966-2000
- Table 6 Immigration, by country. 1966-2000
- Table 7 Emigration, by country. 1966-2000
- Table 8 Migration within and between counties and between counties and foreign countries. 2000
- Table 9 Net migration between counties. 2000
- Table 10 Migration within and between regions. 2000
- Table 11 Net migration between regions. 2000
- Table 12 Internal migration, by sex and age of migrants, and age-specific rates for males and females. 2000
- Table 13 Internal migration, immigration and emigration, by sex, age of migrants and county. 2000
- Table 14 Internal migration, by sex, marital status and 5-year age groups. 2000
- Table 15 Immigration and emigration, by sex, age and marital status of migrants.2000
- Table 16 Immigration and emigration, by Norwegian/foreign citizenship and country of immigration/emigration. 2000
- Table 17 Immigration and emigration, by citizenship, 2000
- Table 18 Immigration and emigration among foreign citizens, by sex, age and citizenship of the migrants. 2000
- Table 19 Migration to/from municipalities and counties. 2000
- Table 20 Internal migration. In-migration, out-migration and net migration. Economic region. 2000
- Table 21 Migration within municipalities. 2000
Contact
-
Statistics Norway's Information Centre
E-mail: informasjon@ssb.no
tel.: (+47) 21 09 46 42
-
Oppdrag befolkningsstatistikk
E-mail: befolkning@ssb.no
-
Even Høydahl
E-mail: even.hoydahl@ssb.no
tel.: (+47) 95 77 79 06


