National population projections, 2020-2100
A historic shift: More elderly than children and teenagers
Published:
Strong ageing, lower population growth, as well as a larger and older immigrant population. According to the 2020 national population projections, these are some of the important changes that will occur this century. In the short term, the Corona pandemic is not expected to increase mortality rates, but fertility and immigration are expected to be temporarily lowered.
- Full set of figures
- National population projections
- Series archive
- Population projections (archive)
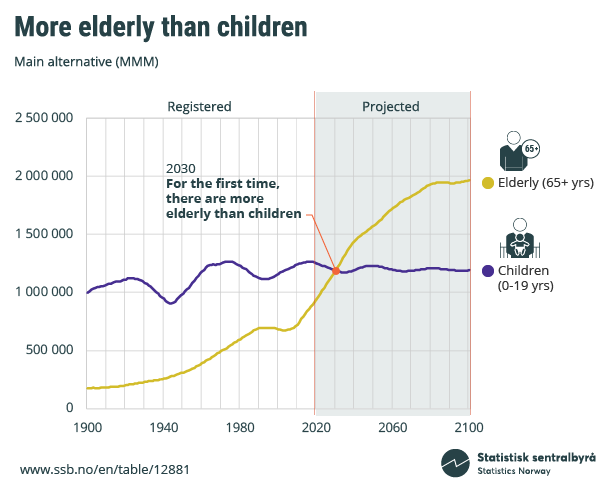
According to the 2020 national population projections, Norway will soon experience an historic demographic shift. Within ten years, and for the first time ever, our main alternative suggests that Norway will have more elderly than children and teenagers.
This change reflects an increasingly rapid process of population ageing in Norway. While ageing is not as strong as it is in other European countries, the number of Norwegians aged 70 or over is expected to double from 670 000 today, to around 1.4 million by 2060. The increase in the population aged 80 or over will be even greater, with the population aged 80+ expected to be three times larger by 2060, while the population aged 90+ is expected to reach almost five times its current size.
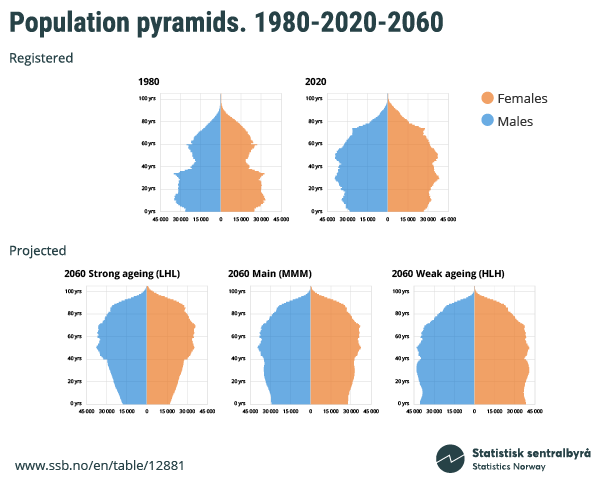
In the population projections, several different alternatives for population development in Norway are developed. We can be especially confident about the occurrence of population ageing because, unlike with many other demographic trends, we observe ageing regardless of the alternatives chosen. However, the speed of population ageing is more uncertain, and depends on the extent to which fertility and migration can work to replenish the share of younger people in the population. This is clearly shown in the figure below where, despite similarities in the number of older people, there is considerable variation in the width of the base of the pyramids.
After 2050 all population growth will be driven by immigration
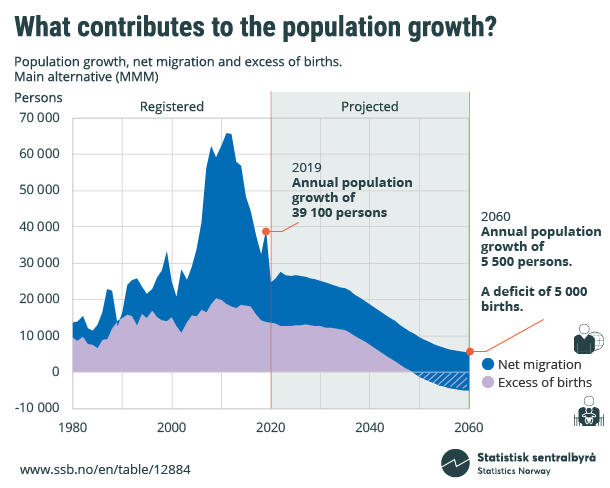
The last couple of decades have witnessed unusually high net immigration, which has contributed to strong population growth in Norway. The birth surplus has been more stable, at around 15 000 annually. In our main alternative, net immigration and the birth surplus will contribute fairly evenly to population growth up to 2040. After 2040, the birth surplus is expected to decline. This is largely a result of the large post-war birth cohorts approaching older ages and dying. By 2050, we expect to reach a point where there are more deaths than births, a so-called birth deficit. The continued growth of the Norwegian population after 2050 will thus be solely due to immigration.
An older immigrant population
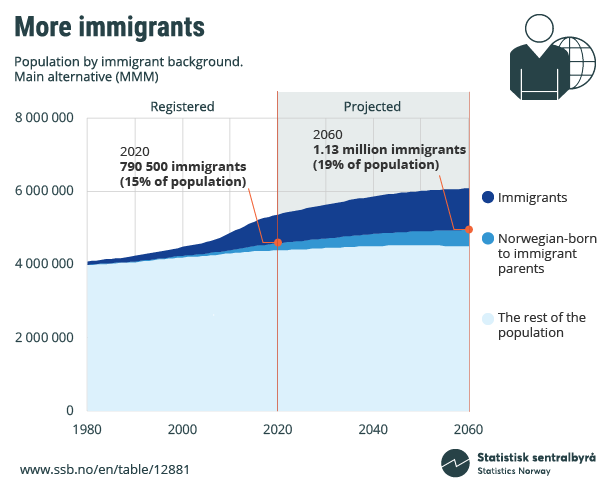
There will be more immigrants living in Norway. Currently, around 790 000 of Norway’s inhabitants are immigrants and, according to our main alternative, this number is expected to increase to around 1.1 million by 2060. The majority will have come from Asia and Africa, but will have lived for many years in Norway.
Indeed, this growth in the immigrant population is expected to be driven by a sharp rise in the number of older immigrants with long durations of stay. According to our main alternative, one in four immigrants in Norway will be aged 70 or over by 2060.
Low fertility in the short term
We have a historically low total fertility rate in Norway today and, due to the Corona pandemic, we expect it to remain low over the next five years. However, despite a modest rise in childlessness and a fall in the number of women having three or more children, much of this fall is associated with women choosing to delay childbearing. With the two-child norm still going strong, completed cohort fertility has fallen only marginally, to just under two (1,96) children, in recent decades. However, the delay in fertility means women today must have children in relatively rapid succession if they are to reach the two-child norm before the end of their reproductive years. We have thus assumed that the total fertility rate will increase to around 1.7 children per woman by 2060, as compared to its current rate of 1.5 today.
Future population growth
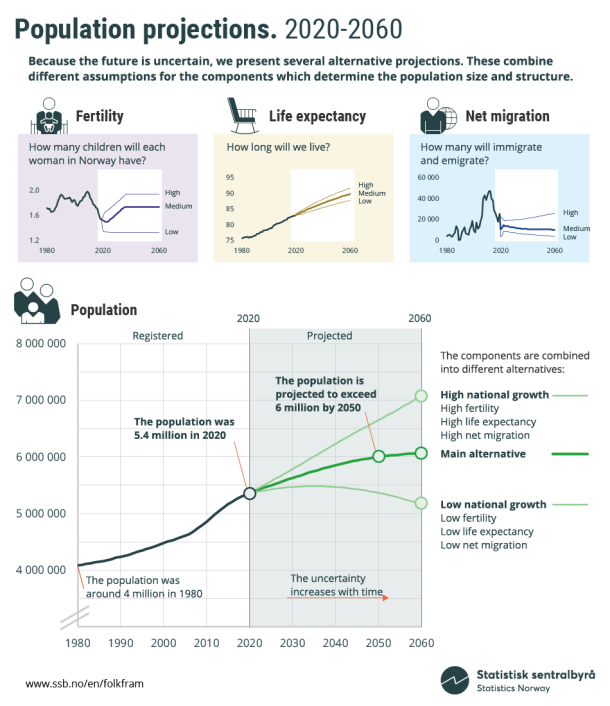
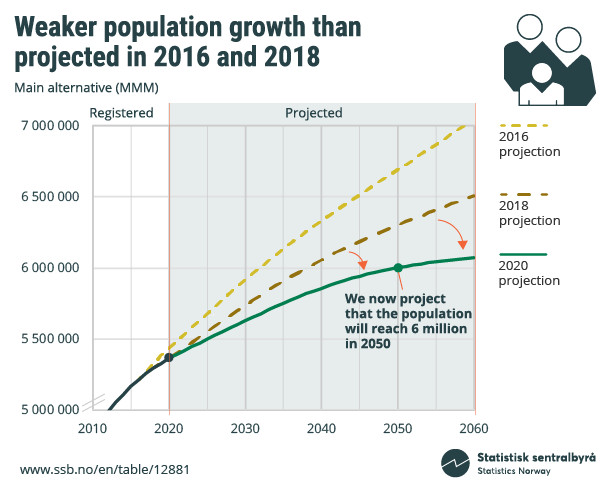
In the main alternative, Norway’s population is expected to increase throughout the coming century, from close to 5.4 million today, to 6.1 million in 2060 and 6.3 million in 2100. This growth is lower than was projected in previous projection rounds, with the estimated population for 2060 being 7 percent lower than the equivalent value in the 2018 projections. The reduction is more pronounced among the younger age groups.
A smaller population in 2060 will likely result in lower overall GDP, but not necessarily in per capita terms. It will also have implications for the per capita income of the oil fund, where we could expect an increase in the per capita income. However, the expenses for pensions and health and care services are unlikely to change much or might even be slightly higher since life expectancy is assumed to increase more than was previously projected.
The reason for the lower level of growth in the main alternative is primarily linked to a lower level of expected immigration. The decline in the first few years is due to the closing of borders and the strict travel restrictions associated with the announcement of the Corona pandemic. However, in the longer term, we expect immigration to fall as a result of an ageing global population. Indeed, while the UN predicts a clear increase in the global population, most of this growth will be among the older population, a group with very low migration propensities.
Our assumptions
We produce several different alternatives for population development in Norway. The main alternative shows how the development will be when we use medium developments in fertility, life expectancy and immigration. This means that:
- Fertility will continue at around 1.5 children per woman in the short term, before gradually rising to a long-term level of 1.7 children per women
- Life expectancy will increase by 8 years for men and 6 years for women by 2060
- Net immigration will settle at around 10 000 in the long run
Population growth is far higher in the high national growth alternative, which assumes high fertility, high life expectancy and high immigration. In the low national growth alternative, with low fertility, low life expectancy and low immigration, the population increases up to 2035, before population decline starts to take hold. The fact that the projections vary between the various alternatives illustrates the importance of the assumptions underpinning our projections. Assumptions relating to immigration are particularly uncertain, but it can also be the case that future fertility, life expectancy and emigration are different from the expected trends. Normally, we see an increase in uncertainty the further forward in time we look.
New this year
In this year’s projections we have produced a table for cohort life expectancy, which is available in the StatBank. The measure accounts for future improvements in mortality and can thus be considered to be a more accurate reflection of actual life expectancy than period measures of life expectancy. By 2040, cohort life expectancy at birth will be around 8-9 years higher than the equivalent period life expectancy. Such increases in life expectancy can be expected to have consequences in terms of demands on health and care services.
This year’s projections also include a stochastic projection. By presenting estimates from both deterministic projections and a stochastic forecast, we hope to contribute to a more in-depth appreciation of the inherent uncertainty associated with population projections. While differences between the projected estimates exist, there is a high degree of alignment between the two models in their overall results, with both supporting the headline message of population ageing in Norway. The results of the stochastic forecast are available in the StatBank.
As well as the new products, the StatBank contains detailed results from this year’s national population projection, providing information on the entire population up to and including 2100. Figures from previous projection rounds are also available at the StatBank. Detailed information on the methods, assumptions and results of this year’s population projections are available in the 2020 national population projections report.
Contact
-
Inquiries about national projections
-
Astri Syse
-
Michael Thomas
-
Rebecca Gleditsch
-
Statistics Norway's Information Centre

