Content
Published:
This is an archived release.
Decrease in money supply growth
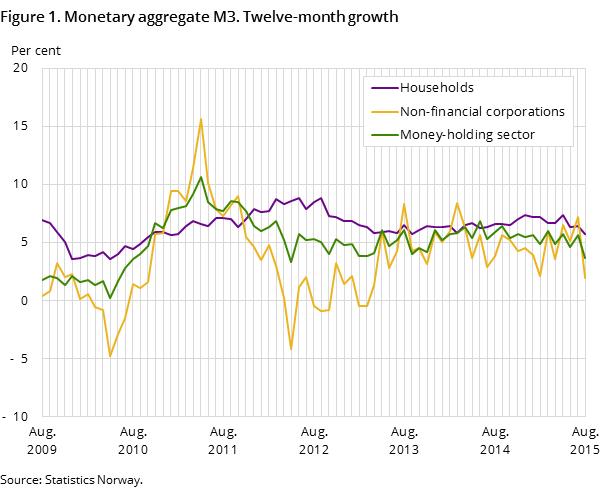
The twelve-month growth in the monetary aggregate M3 was 3.7 per cent to end-August, down from 5.6 per cent the previous month. Households’ growth in M3 was 5.7 per cent to end-August, down from 6.4 per cent the previous month.
| May 2015 | June 2015 | July 2015 | August 2015 | |
|---|---|---|---|---|
| Money holding sector | 5.7 | 4.6 | 5.6 | 3.7 |
| Other financial corporations | -8.2 | -8.2 | -8.0 | -4.4 |
| Municipal government | 3.7 | 3.5 | 8.3 | 3.8 |
| Non-financial corporations | 6.5 | 5.1 | 7.2 | 1.9 |
| Households etc. | 7.4 | 6.3 | 6.4 | 5.7 |

The twelve-month growth in households’ money supply was lower than the growth in households’ gross domestic debt, which was 6.4 per cent to end-August according to the credit indicator C2.
The money supply growth for non-financial corporations was 1.9 per cent to end-August, while the growth for municipal government was 3.8 per cent. Other financial corporations accounted for the last share of the money supply, and this sector’s money supply growth was -4.4 per cent to end-August.
More than half of the money supply in households
The monetary aggregate M3 was NOK 1 901 billion at the end of August, down from NOK 1 937 billion previous month. Households constitutes for more than half of the total monetary aggregate M3. At end-August this broad monetary aggregate amounted to NOK 1 116 billion, marginally down from NOK 1 118 billion at end-July.
The money supply for non-financial corporations was NOK 583 billion at end-August, down from NOK 602 billion at end-July. The money supply for municipal government and other financial corporations amounted to NOK 72 billion and NOK 131 billion respectively.
Steady composition of money supply
The composition of the money supply remains steady after the restructuring of the M3 statistics. Transaction deposits accounted for 89.3 per cent of the total money supply, while other deposits accounted for 7.8 per cent at the end of August. Notes and coins accounted for 2.4 per cent, while repurchase agreements, debt securities and bonds in total accounted for 0.5 per cent of the money supply at end-August.
Changes in the money supply statisticsOpen and readClose
The money supply statistics is restructured according to the ECB’s guidelines. This implies that the money statistics in Norway is more comparable to monetary statistics in other countries. The change includes that the monetary aggregate M3 is used as a general term for the money supply, with M1 and M2 as subsets. In addition, the restructuring causes changes in the money supply objects and scope, changes in the definitions of money-issuing and money-holding sectors, as well as some changes in data sources. The new time series is not comparable to previously published time series. For more information, see the ‘About statistics’ tab and ‘Pengemengdestatistikken 2015’ (in Norwegian only).
New specifications on depositsOpen and readClose
From April 2015, a new specification of deposits was implemented in the banks’ reporting of deposits. This causes a break in time series for stocks, which implies that the time series from April this year are not comparable to previous periods. The transaction- and growth series are adjusted for this break and are unaffected by new deposit specifications. For more information, please see the ‘About the statistics’ tab and ‘Pengemengdestatistikken 2015’ (in Norwegian only).
Contact
-
Monetary aggregates
E-mail: pengemengde@ssb.no
-
Mons Even Oppedal
E-mail: mons.even.oppedal@ssb.no
tel.: (+47) 98 68 18 24
