Content
Published:
This is an archived release.
Higher share of foreign market funding
An increasing share of banks’ total money market funding stems from foreign sources. The increase is mainly due to increased inter-bank loans between Norwegian and foreign banks.
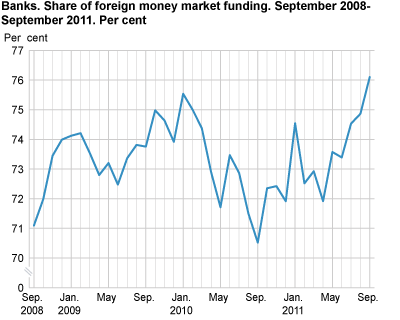
By the end of September 2011, the banks’ total money market funding from foreign sources was nearly NOK 1 053 billion, which constitutes 76.1 per cent of banks’ total market funding. This is an increase of 1.2 percentage points from the previous month, and is the highest share of foreign money market funding since March 2007.
Increase caused by inter-bank loans
More than 50 per cent of the banks’ money market funding is foreign inter-bank loans, and these loans amounted to NOK 749.7 billion at end-September 2011. This is an increase of NOK 642 million compared to the previous month, which equals an increase of 9.4 per cent. Inter-bank loans between Norwegian banks constitute 3.9 per cent in the same period. The share of Norwegian inter-bank loans has been relatively stable the last two years, varying between 3 and 5 per cent.
The twelve-month growth rate in foreign inter-bank loans is 12.4 per cent in September this year. This is the highest twelve-month growth rate since June 2010. Foreign funding mainly consists of loans in foreign currencies which are converted into NOK, and may therefore be affected by changes in the exchange rates.
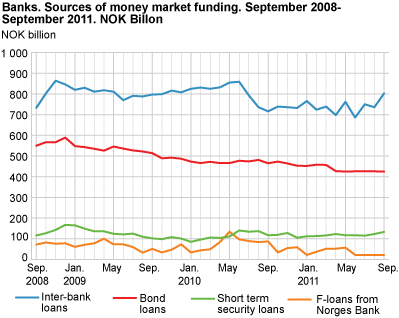
Short-term security loans nearly unchanged
In addition to inter-bank loans, the banks’ money market funding consists of short-term security loans, bond loans and F-loans from the Norwegian central bank. By end-September this year, short-term security loans amounted to NOK 133 billion; a share of 9.6 per cent of total funding. This is a marginal increase of 0.2 percentage points compared to the August 2011 figures. Foreign short-term security loans dominate; Norwegian short-term security loans stand for just 0.9 per cent of total money market funding.
Bond loans amounted to nearly NOK 425 billion by the end of September 2011; a share of 30.7 per cent of total money market funding. This is a decrease of 1.9 percentage points compared to the previous month, and the lowest share of bond loans in funding since June 2010. F-loans from the central bank amounted to NOK 22 billion at end-September 2011, and remained unchanged the previous four months.
Increased customer deposits
The banks finance their lending through customer deposits in addition to the money market funding. These customer deposits amounted to NOK 2 542 billion at the end of September 2011; an increase of NOK 115 billion compared to the previous month. This equals a share of 65.8 per cent of the banks’ total funding.
| Inter-bank loans from Norwegian banks |
Inter-bank loans from foreign banks |
Norwegian short term security loans |
Foreign short term security loans |
Norwegian bond loans |
Foreign bond loans |
F-loans from Norges Bank |
|||||||||||||||||||||||||||||||||||||||||||||||||||||||||||||||||||||||||
|---|---|---|---|---|---|---|---|---|---|---|---|---|---|---|---|---|---|---|---|---|---|---|---|---|---|---|---|---|---|---|---|---|---|---|---|---|---|---|---|---|---|---|---|---|---|---|---|---|---|---|---|---|---|---|---|---|---|---|---|---|---|---|---|---|---|---|---|---|---|---|---|---|---|---|---|---|---|---|---|
| 2010 | |||||||||||||||||||||||||||||||||||||||||||||||||||||||||||||||||||||||||||||||
| September | 4 878 | 666 818 | 15 183 | 101 870 | 257 379 | 207 652 | 86 819 | ||||||||||||||||||||||||||||||||||||||||||||||||||||||||||||||||||||||||
| October | 72 515 | 666 908 | 13 947 | 105 435 | 257 242 | 215 529 | 33 805 | ||||||||||||||||||||||||||||||||||||||||||||||||||||||||||||||||||||||||
| November | 53 638 | 682 858 | 13 906 | 114 008 | 258 550 | 205 153 | 55 447 | ||||||||||||||||||||||||||||||||||||||||||||||||||||||||||||||||||||||||
| December | 51 723 | 679 961 | 12 489 | 92 336 | 255 708 | 197 135 | 58 674 | ||||||||||||||||||||||||||||||||||||||||||||||||||||||||||||||||||||||||
| 2011 | |||||||||||||||||||||||||||||||||||||||||||||||||||||||||||||||||||||||||||||||
| January | 55 834 | 710 244 | 11 921 | 100 199 | 254 551 | 197 804 | 22 023 | ||||||||||||||||||||||||||||||||||||||||||||||||||||||||||||||||||||||||
| February | 64 939 | 659 345 | 11 087 | 102 043 | 253 197 | 204 989 | 37 022 | ||||||||||||||||||||||||||||||||||||||||||||||||||||||||||||||||||||||||
| March | 55 384 | 684 004 | 9 493 | 106 422 | 252 601 | 204 809 | 52 021 | ||||||||||||||||||||||||||||||||||||||||||||||||||||||||||||||||||||||||
| April | 56 702 | 641 032 | 9 577 | 113 000 | 246 577 | 180 371 | 52 021 | ||||||||||||||||||||||||||||||||||||||||||||||||||||||||||||||||||||||||
| May | 50 805 | 711 229 | 8 093 | 109 179 | 243 750 | 181 653 | 57 275 | ||||||||||||||||||||||||||||||||||||||||||||||||||||||||||||||||||||||||
| June | 55 736 | 629 828 | 9 883 | 106 863 | 244 967 | 180 714 | 22 022 | ||||||||||||||||||||||||||||||||||||||||||||||||||||||||||||||||||||||||
| July | 57 432 | 692 863 | 10 186 | 104 622 | 244 835 | 181 426 | 22 023 | ||||||||||||||||||||||||||||||||||||||||||||||||||||||||||||||||||||||||
| August | 50 639 | 685 430 | 11 624 | 111 862 | 244 371 | 181 510 | 22 020 | ||||||||||||||||||||||||||||||||||||||||||||||||||||||||||||||||||||||||
| September | 53 686 | 749 673 | 12 365 | 120 948 | 242 513 | 182 101 | 22 021 | ||||||||||||||||||||||||||||||||||||||||||||||||||||||||||||||||||||||||
|
Money market funding is defined by the sum of inter-bank loans, short-term security loans, bond loans and F-loans from the central bank. In addition to the market funding, banks finance their lending through customer deposits.
F - loans from Norges Bank are a part of the liquidity supply to the banks. They are loans with collateral in securities at a fixed exchange rate and given terms.
Inter - bank loans are short-term loans between banks. It should be noted that a certain share of foreign inter-bank loans to Norwegian banks could originate from loans from a foreign parent company to Norwegian branch companies. |
|
As a large part of the foreign money market funding is in foreign currency, changes in exchange rates may therefore influence the figures. |
Tables
The statistics is now published as Banks and mortgage companies.
Contact
-
Statistics Norway's Information Centre
E-mail: informasjon@ssb.no
tel.: (+47) 21 09 46 42