Content
Published:
This is an archived release.
Decreasing funding from the money market
About 43 per cent of Norwegian banks’ funding takes place in the money market, mainly from foreign sources. The twelve-month growth in the funding from the money market went down from -13.1 per cent to -20.5 per cent in June.
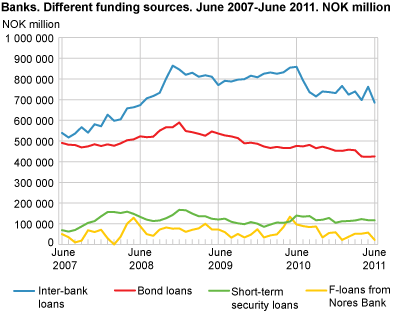
Banks finance their operations from different sources, such as deposits, inter-bank loans, bond loans, short-term security loans and loans from Norges Bank. Customer deposits are often the safest, least expensive and most stable of these sources. At end-June the deposits amounted to NOK 1 674 billion, up from NOK 1 654 last month. The rest of the funding sources comes from the market and went down from NOK 1 360 billion to NOK 1 250 billion in the same period.
Most of the funding from the market stems from foreign sources
The banks’ short-term security loans, bond loans and inter-bank loans from foreign sources constituted more than 73 per cent of the total funding from the market at end-June 2011. This share has been relatively stable and above 70 per cent during the past three years. Because of the high level, the Norwegian banks are directly affected by the situation in the international credit markets.
Decreasing inter-bank loans from the foreign market
Total inter-bank loans amounted to NOK 686 billion at end-June, and are thereby the biggest source of funding from the market. The twelve-month growth to end-June was -20.2 per cent.
Inter-bank loans from foreign banks constituted close to 92 per cent of total inter-bank loans at end-June. The twelve-month growth from these banks went down from -12.0 per cent to -21.5 per cent in June. At the end of 2010 Sweden was the biggest counterpart of inter-bank loans with more than one third of the foreign inter-bank loans. Other important counterparts were Denmark, Finland and USA, each with more than 10 per cent of foreign inter-bank loans.
Foreign bond debt also decreases
Bond loans are an important long-term funding source for the banks, and amounted to NOK 424 billion at end-June. The twelve-month growth was -11.1 per cent to end-June, down from
-9.2 per cent last month. This is the lowest growth since June last year, and the decrease stems from foreign sources.
Bond debt to foreign sectors amounted to NOK 181 billion, or close to 43 per cent, of the total bond debt at end-June. As a comparison this share was almost 47 per cent at end-June last year. The twelve-month growth for the banks’ foreign bond debt was -19,8 per cent at end-June 2011, considerably lower than the twelve-month growth for Norwegian and foreign bond loans together.
Low share of short-term security loans from Norwegian sectors
The banks’ short-term security loans were NOK 117 billion at end-June. The twelve-month growth is thus -16.4 per cent, and fluctuates from month to month.
Short-term security debt to Norwegian sectors accounted for 8.5 per cent of total short-term security debt at end-June. This amounts to NOK 9.9 billion.
Fluctuations in F-loans from Norges Bank
F-loans amounted to NOK 22 billion at end-June, and this is 1.8 per cent of the banks’ total market funding. This share has fluctuated between 1.6 and 8.6 per cent for the past two years.
| Inter-bank loans from Norwegian banks | Inter-bank loans from foreign banks | Norwegian bond loans | Foreign bond loans | Norwegian short-term security loans | Foreign short term security loans | F-loans from Norges Bank | |||||||||||||||||||||||||||||||||||||||||||||||||||||||||||||||||||||||||
|---|---|---|---|---|---|---|---|---|---|---|---|---|---|---|---|---|---|---|---|---|---|---|---|---|---|---|---|---|---|---|---|---|---|---|---|---|---|---|---|---|---|---|---|---|---|---|---|---|---|---|---|---|---|---|---|---|---|---|---|---|---|---|---|---|---|---|---|---|---|---|---|---|---|---|---|---|---|---|---|
| 2010 | |||||||||||||||||||||||||||||||||||||||||||||||||||||||||||||||||||||||||||||||
| June | 55 961 | 802 724 | 251 222 | 225 378 | 13 009 | 126 627 | 96 820 | ||||||||||||||||||||||||||||||||||||||||||||||||||||||||||||||||||||||||
| July | 50 553 | 742 747 | 251 956 | 222 027 | 13 125 | 121 262 | 88 821 | ||||||||||||||||||||||||||||||||||||||||||||||||||||||||||||||||||||||||
| August | 58 448 | 677 931 | 254 254 | 227 000 | 13 608 | 123 600 | 83 821 | ||||||||||||||||||||||||||||||||||||||||||||||||||||||||||||||||||||||||
| September | 48 781 | 666 818 | 257 379 | 207 652 | 15 183 | 101 870 | 86 819 | ||||||||||||||||||||||||||||||||||||||||||||||||||||||||||||||||||||||||
| October | 72 515 | 666 908 | 257 242 | 215 529 | 13 947 | 105 435 | 33 805 | ||||||||||||||||||||||||||||||||||||||||||||||||||||||||||||||||||||||||
| November | 53 638 | 682 858 | 258 550 | 205 153 | 13 906 | 114 008 | 55 447 | ||||||||||||||||||||||||||||||||||||||||||||||||||||||||||||||||||||||||
| December | 51 723 | 679 961 | 255 708 | 197 135 | 12 489 | 92 336 | 58 674 | ||||||||||||||||||||||||||||||||||||||||||||||||||||||||||||||||||||||||
| 2011 | |||||||||||||||||||||||||||||||||||||||||||||||||||||||||||||||||||||||||||||||
| January | 55 834 | 710 244 | 254 551 | 197 804 | 11 921 | 100 199 | 22 023 | ||||||||||||||||||||||||||||||||||||||||||||||||||||||||||||||||||||||||
| February | 64 939 | 659 345 | 253 197 | 204 989 | 11 087 | 102 043 | 37 022 | ||||||||||||||||||||||||||||||||||||||||||||||||||||||||||||||||||||||||
| March | 55 384 | 684 004 | 252 601 | 202 796 | 9 493 | 106 422 | 52 021 | ||||||||||||||||||||||||||||||||||||||||||||||||||||||||||||||||||||||||
| April | 56 702 | 641 032 | 246 577 | 178 358 | 9 577 | 113 000 | 52 021 | ||||||||||||||||||||||||||||||||||||||||||||||||||||||||||||||||||||||||
| May | 50 805 | 711 229 | 243 750 | 179 639 | 8 093 | 109 179 | 57 275 | ||||||||||||||||||||||||||||||||||||||||||||||||||||||||||||||||||||||||
| June | 55 736 | 629 828 | 244 967 | 180 714 | 9 883 | 106 863 | 22 022 | ||||||||||||||||||||||||||||||||||||||||||||||||||||||||||||||||||||||||
|
F-loans from Norges Bank are a part of the liquidity supply to the banks. They are loans with collateral in securities at a fixed exchange rate and given terms. The terms for these loans have normally been under a week, but due to the turbulence in the financial markets, Norges Bank enabled loans of up to two years.
As a large part of the foreign funding is in foreign currency, changes in exchange rates may therefore influence the figures. |
Tables
The statistics is now published as Banks and mortgage companies.
Contact
-
Statistics Norway's Information Centre
E-mail: informasjon@ssb.no
tel.: (+47) 21 09 46 42