Content
Published:
This is an archived release.
Increase in deposits higher than 2 million
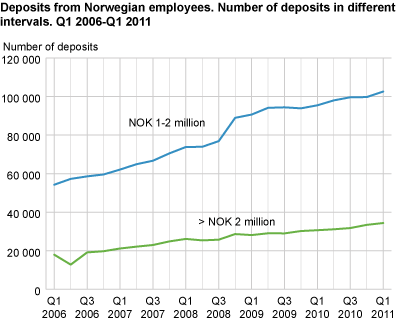
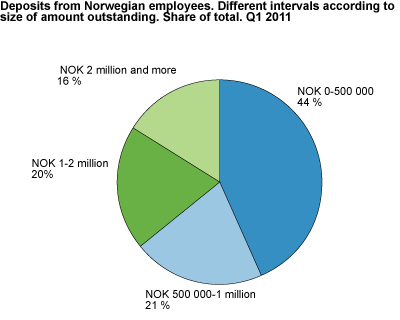
At the end of the 1st quarter of 2011, the number of bank deposits exceeding NOK 2 million by employees in Norway was 34 400. These deposits amounted to 16 per cent of all deposits by employees.
At the end of the 1st quarter, deposits by employees of NOK 2 million or less totalled NOK 603 billion. This means that 84 per cent of deposits by employees were covered by the Norwegian Banks’ Guarantee Fund. A total of 99.5 per cent of the depositors were covered if we look at the number of depositors. The share of deposits higher than NOK 2 million has increased in the last three quarters, and is now at the same level as in 2008. The figures show that 102 557 employees had deposits between NOK 1 and 2 million. These deposits amounted to NOK 140 billion.
Increase in the twelve-month growth
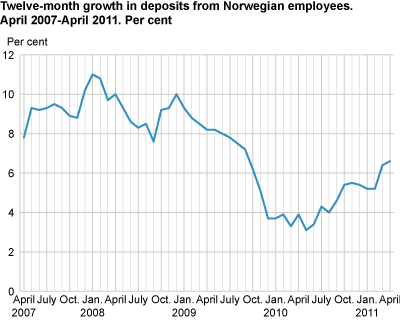
The twelve-month growth in deposits from employees was 6.6 per cent at end-April 2011. This is the highest twelve-month growth for this figure since September 2009. Deposits on accounts concerning home savings schemes for young people, transactions and other deposits have increased by NOK 3, 10 and 38 billion respectively in the last year. In the same period, deposits with yield based on the stock exchange have decreased by NOK 6 billion. Hence, total deposits from employees have increased by NOK 46 billion since April 2010.
NOK 108 000 on average
Norwegian employees had a total of NOK 718 billion in Norwegian banks at the end of the first quarter this year. This means that every depositor had a deposit equal to NOK 108 000 on average. The corresponding figure five years ago was NOK 84 000.
| Amount (NOK mill.) | Number of depositors | ||||||||||||||||||||||||||||||||||||||||||||||||||||||||||||||||||||||||||||||
|---|---|---|---|---|---|---|---|---|---|---|---|---|---|---|---|---|---|---|---|---|---|---|---|---|---|---|---|---|---|---|---|---|---|---|---|---|---|---|---|---|---|---|---|---|---|---|---|---|---|---|---|---|---|---|---|---|---|---|---|---|---|---|---|---|---|---|---|---|---|---|---|---|---|---|---|---|---|---|---|
| 0-500' | 500'-1 mill. | 1-2 mill. | 2-20 mill. | >20 mill. | 0-500' | 500'-1 mill. | 1-2 mill. | 2-20 mill. | >20 mill. | ||||||||||||||||||||||||||||||||||||||||||||||||||||||||||||||||||||||
| 2006 | |||||||||||||||||||||||||||||||||||||||||||||||||||||||||||||||||||||||||||||||
| Q1 | 260 783 | 98 877 | 71 569 | 60 265 | 11 866 | 5 780 846 | 147 022 | 54 272 | 17 808 | 157 | |||||||||||||||||||||||||||||||||||||||||||||||||||||||||||||||||||||
| Q2 | 288 609 | 103 598 | 76 448 | 62 772 | 9 288 | 5 835 148 | 152 136 | 57 288 | 12 673 | 161 | |||||||||||||||||||||||||||||||||||||||||||||||||||||||||||||||||||||
| Q3 | 276 520 | 104 761 | 78 820 | 64 970 | 6 643 | 5 833 489 | 152 570 | 58 592 | 19 010 | 153 | |||||||||||||||||||||||||||||||||||||||||||||||||||||||||||||||||||||
| Q4 | 275 576 | 106 636 | 80 120 | 66 688 | 6 994 | 5 871 163 | 156 160 | 59 574 | 19 613 | 161 | |||||||||||||||||||||||||||||||||||||||||||||||||||||||||||||||||||||
| 2007 | |||||||||||||||||||||||||||||||||||||||||||||||||||||||||||||||||||||||||||||||
| Q1 | 276 771 | 109 400 | 83 618 | 71 188 | 7 770 | 5 888 226 | 160 120 | 62 125 | 21 002 | 190 | |||||||||||||||||||||||||||||||||||||||||||||||||||||||||||||||||||||
| Q2 | 302 723 | 113 606 | 87 331 | 74 521 | 11 401 | 5 958 821 | 167 365 | 64 891 | 21 956 | 197 | |||||||||||||||||||||||||||||||||||||||||||||||||||||||||||||||||||||
| Q3 | 290 107 | 114 675 | 90 153 | 77 473 | 8 933 | 5 955 074 | 167 464 | 66 708 | 22 796 | 208 | |||||||||||||||||||||||||||||||||||||||||||||||||||||||||||||||||||||
| Q4 | 286 924 | 117 859 | 94 884 | 83 392 | 7 712 | 6 554 015 | 172 738 | 70 514 | 24 661 | 210 | |||||||||||||||||||||||||||||||||||||||||||||||||||||||||||||||||||||
| 2008 | |||||||||||||||||||||||||||||||||||||||||||||||||||||||||||||||||||||||||||||||
| Q1 | 282 402 | 120 521 | 99 634 | 88 839 | 10 589 | 6 026 647 | 176 301 | 73 818 | 25 923 | 234 | |||||||||||||||||||||||||||||||||||||||||||||||||||||||||||||||||||||
| Q2 | 323 868 | 118 424 | 98 551 | 86 052 | 11 401 | 7 177 068 | 174 922 | 73 928 | 25 190 | 210 | |||||||||||||||||||||||||||||||||||||||||||||||||||||||||||||||||||||
| Q3 | 302 390 | 120 347 | 104 104 | 85 707 | 10 358 | 7 144 322 | 176 535 | 76 865 | 25 547 | 215 | |||||||||||||||||||||||||||||||||||||||||||||||||||||||||||||||||||||
| Q4 | 307 001 | 126 581 | 122 461 | 84 904 | 9 092 | 7 032 414 | 185 828 | 88 952 | 28 478 | 200 | |||||||||||||||||||||||||||||||||||||||||||||||||||||||||||||||||||||
| 2009 | |||||||||||||||||||||||||||||||||||||||||||||||||||||||||||||||||||||||||||||||
| Q1 | 306 234 | 128 972 | 124 789 | 84 779 | 8 599 | 7 169 051 | 187 565 | 90 633 | 27 963 | 190 | |||||||||||||||||||||||||||||||||||||||||||||||||||||||||||||||||||||
| Q2 | 327 566 | 138 024 | 129 456 | 88 083 | 8 580 | 6 131 234 | 200 242 | 94 135 | 28 902 | 176 | |||||||||||||||||||||||||||||||||||||||||||||||||||||||||||||||||||||
| Q3 | 308 234 | 137 761 | 128 257 | 87 636 | 8 442 | 6 213 622 | 200 578 | 94 387 | 28 856 | 168 | |||||||||||||||||||||||||||||||||||||||||||||||||||||||||||||||||||||
| Q4 | 307 447 | 138 564 | 127 800 | 90 562 | 9 197 | 6 253 667 | 202 345 | 93 864 | 30 072 | 172 | |||||||||||||||||||||||||||||||||||||||||||||||||||||||||||||||||||||
| 2010 | |||||||||||||||||||||||||||||||||||||||||||||||||||||||||||||||||||||||||||||||
| Q1 | 304 745 | 139 905 | 130 158 | 92 423 | 7 701 | 6 251 829 | 203 455 | 95 440 | 30 493 | 179 | |||||||||||||||||||||||||||||||||||||||||||||||||||||||||||||||||||||
| Q2 | 334 652 | 145 296 | 134 002 | 94 094 | 7 627 | 6 319 615 | 211 928 | 97 997 | 30 966 | 182 | |||||||||||||||||||||||||||||||||||||||||||||||||||||||||||||||||||||
| Q3 | 315 191 | 145 615 | 135 913 | 96 430 | 7 991 | 6 318 820 | 212 537 | 99 605 | 31 598 | 194 | |||||||||||||||||||||||||||||||||||||||||||||||||||||||||||||||||||||
| Q4 | 316 536 | 146 549 | 136 007 | 101 770 | 9 246 | 6 302 013 | 211 150 | 99 701 | 33 251 | 198 | |||||||||||||||||||||||||||||||||||||||||||||||||||||||||||||||||||||
| 2011 | |||||||||||||||||||||||||||||||||||||||||||||||||||||||||||||||||||||||||||||||
| Q1 | 314 113 | 148 785 | 139 934 | 105 372 | 8 835 | 6 305 634 | 213 393 | 102 557 | 34 189 | 205 | |||||||||||||||||||||||||||||||||||||||||||||||||||||||||||||||||||||
Transaction or working accountsDeposits in working accounts are deposits that can be used for direct transactions without generating any additional costs beyond ordinary transaction costs.
Other depositsOther deposits include deposits on accounts that cannot be used for direct transactions without generating any additional costs beyond ordinary transaction costs, or accounts with restrictions on direct transactions. |
Tables
The statistics is now published as Banks and mortgage companies.
Contact
-
Statistics Norway's Information Centre
E-mail: informasjon@ssb.no
tel.: (+47) 21 09 46 42


