Content
Published:
This is an archived release.
Decline in loans to manufacturing industry
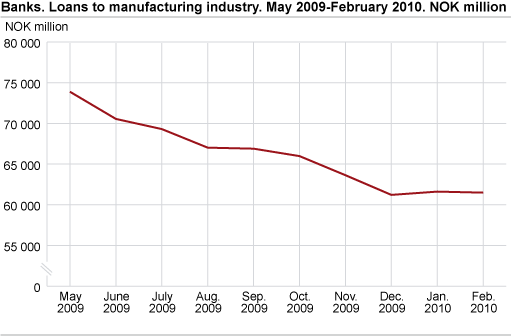
Total loans from Norwegian banks to the manufacturing industry decreased from NOK 74 billion at the end of May 2009 to NOK 61 billion at the end of February 2010. This equals a reduction of 16.8 per cent.
Loans to the manufacturing industry accounted for 6.2 per cent of total loans to Norwegian industries for Norwegian banks at the end of February 2010. In a historical perspective, the loans to the manufacturing industry are relatively high in volume, even if the volume of loans today is considerably lower than in 2007 and 2008.
Decline in total loans to industries
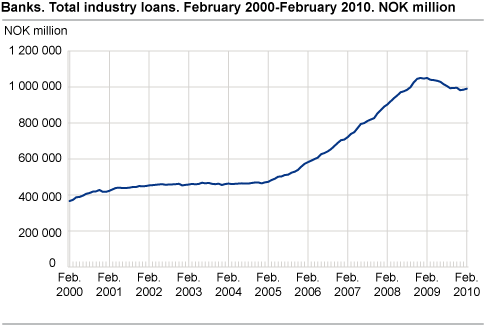
Norwegian banks’ total loans to industries amounted to NOK 990 billion at the end of February 2010. From February 2009 to February 2010 the loans to Norwegian industries declined by NOK 60 billion, which equals a reduction of 5.7 per cent.
Lower demand from the companies together with more stringent credit practice by the banks may have influenced the decline in loans last year. However, total loans to Norwegian industries can still be considered to be at a high level.
| Borrower industry | May 2009 | June 2009 | July 2009 | August 2009 | September 2009 | October 2009 | November 2009 | December 2009 | January 2010 | February 2010 | |||||||||||||||||||||||||||||||||||||||||||||||||||||||||||||||||||||
|---|---|---|---|---|---|---|---|---|---|---|---|---|---|---|---|---|---|---|---|---|---|---|---|---|---|---|---|---|---|---|---|---|---|---|---|---|---|---|---|---|---|---|---|---|---|---|---|---|---|---|---|---|---|---|---|---|---|---|---|---|---|---|---|---|---|---|---|---|---|---|---|---|---|---|---|---|---|---|---|
| Total industry loans | 1 034 478 | 1 028 899 | 1 015 271 | 1 005 264 | 993 087 | 994 522 | 995 366 | 982 090 | 984 787 | 990 415 | |||||||||||||||||||||||||||||||||||||||||||||||||||||||||||||||||||||
| Agriculture | 33 259 | 32 851 | 33 113 | 33 295 | 33 321 | 33 533 | 33 494 | 34 079 | 34 255 | 33 164 | |||||||||||||||||||||||||||||||||||||||||||||||||||||||||||||||||||||
| Forestry | 2 150 | 2 244 | 2 245 | 2 238 | 2 234 | 2 231 | 2 238 | 2 258 | 2 250 | 2 220 | |||||||||||||||||||||||||||||||||||||||||||||||||||||||||||||||||||||
| Fishing and hunting | 21 471 | 20 869 | 20 742 | 20 780 | 20 859 | 20 905 | 21 102 | 21 474 | 21 840 | 21 502 | |||||||||||||||||||||||||||||||||||||||||||||||||||||||||||||||||||||
| Fish farming services | 11 922 | 12 407 | 12 416 | 12 305 | 12 720 | 12 643 | 12 798 | 12 397 | 12 249 | 11 829 | |||||||||||||||||||||||||||||||||||||||||||||||||||||||||||||||||||||
| Mining and quarrying | 1 830 | 1 946 | 1 890 | 1 916 | 1 899 | 1 856 | 1 873 | 1 956 | 1 935 | 1 966 | |||||||||||||||||||||||||||||||||||||||||||||||||||||||||||||||||||||
| Services linked to extraction of crude petroleum and natural gas | 19 791 | 19 266 | 18 682 | 18 193 | 16 789 | 15 802 | 15 733 | 12 993 | 12 929 | 13 274 | |||||||||||||||||||||||||||||||||||||||||||||||||||||||||||||||||||||
| Extraction of crude petroleum and natural gas | 1 222 | 1 488 | 1 680 | 1 533 | 1 697 | 1 653 | 1 847 | 1 532 | 1 047 | 1 229 | |||||||||||||||||||||||||||||||||||||||||||||||||||||||||||||||||||||
| Manufacturing | 73 890 | 70 553 | 69 306 | 67 022 | 66 897 | 65 984 | 63 637 | 61 219 | 61 621 | 61 496 | |||||||||||||||||||||||||||||||||||||||||||||||||||||||||||||||||||||
| Ship and boat building | 12 782 | 12 262 | 12 235 | 12 746 | 12 768 | 12 734 | 13 446 | 13 124 | 12 432 | 12 649 | |||||||||||||||||||||||||||||||||||||||||||||||||||||||||||||||||||||
| Electricity and water supply | 24 608 | 22 736 | 22 989 | 22 284 | 22 400 | 21 707 | 23 011 | 22 863 | 26 201 | 27 136 | |||||||||||||||||||||||||||||||||||||||||||||||||||||||||||||||||||||
| Water supply, drainage and waste disposal | 2 849 | 2 916 | 2 972 | 3 067 | 3 093 | 3 112 | 3 145 | 3 173 | 3 173 | 3 157 | |||||||||||||||||||||||||||||||||||||||||||||||||||||||||||||||||||||
| Real estate development | 51 342 | 52 675 | 52 250 | 51 179 | 51 159 | 51 502 | 51 175 | 49 777 | 49 444 | 49 185 | |||||||||||||||||||||||||||||||||||||||||||||||||||||||||||||||||||||
| Building and construction work | 24 583 | 26 007 | 25 424 | 25 784 | 25 073 | 24 260 | 24 102 | 23 403 | 23 746 | 24 179 | |||||||||||||||||||||||||||||||||||||||||||||||||||||||||||||||||||||
| Commodity trade etc | 67 846 | 67 556 | 66 628 | 63 850 | 62 627 | 61 827 | 61 901 | 59 549 | 60 255 | 62 668 | |||||||||||||||||||||||||||||||||||||||||||||||||||||||||||||||||||||
| Sea transport abroad and transport via pipelines | 78 751 | 83 857 | 82 484 | 80 626 | 78 598 | 76 433 | 76 966 | 76 865 | 76 861 | 78 203 | |||||||||||||||||||||||||||||||||||||||||||||||||||||||||||||||||||||
| Transportation and storage | 28 524 | 27 821 | 27 249 | 26 925 | 26 260 | 25 855 | 25 699 | 25 880 | 25 742 | 25 528 | |||||||||||||||||||||||||||||||||||||||||||||||||||||||||||||||||||||
| Hotels and restaurants | 10 756 | 10 609 | 10 587 | 12 581 | 12 406 | 12 537 | 12 075 | 11 397 | 11 457 | 10 982 | |||||||||||||||||||||||||||||||||||||||||||||||||||||||||||||||||||||
| Information and communication | 17 936 | 16 926 | 15 911 | 15 969 | 13 791 | 14 024 | 13 900 | 12 865 | 12 926 | 12 862 | |||||||||||||||||||||||||||||||||||||||||||||||||||||||||||||||||||||
| Real estate, renting and business activities | 396 769 | 397 586 | 398 324 | 399 080 | 397 662 | 404 585 | 407 832 | 407 796 | 406 566 | 408 851 | |||||||||||||||||||||||||||||||||||||||||||||||||||||||||||||||||||||
| Professional and financial services | 94 903 | 90 002 | 84 075 | 80 862 | 78 354 | 78 012 | 76 754 | 75 469 | 75 638 | 75 869 | |||||||||||||||||||||||||||||||||||||||||||||||||||||||||||||||||||||
| Businesslike services | 30 275 | 26 359 | 23 933 | 22 432 | 21 827 | 22 973 | 22 747 | 22 732 | 22 963 | 23 112 | |||||||||||||||||||||||||||||||||||||||||||||||||||||||||||||||||||||
| Other service activities | 27 019 | 29 963 | 30 136 | 30 597 | 30 653 | 30 354 | 29 891 | 29 289 | 29 257 | 29 354 | |||||||||||||||||||||||||||||||||||||||||||||||||||||||||||||||||||||
From end-May 2009 to end-February 2010, total industry loans from Norwegian banks declined by 4.3 per cent .
Small changes in loans to real estate activities and shipping
The industry consisting of real estate, renting and business activities is by far the largest borrowing industry in Norwegian banks, accounting for 41.3 per cent of total bank loans to Norwegian industries. By the end of February 2010 the stock of outstanding loans to real estate businesses in Norwegian banks amounted to NOK 409 billion. The increase from May 2009 to February 2010 was 3.1 per cent.
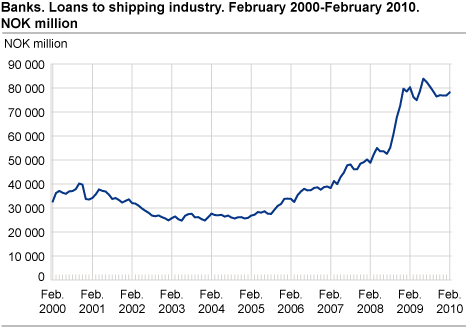
Loans to sea transport abroad and transport via pipelines, also called shipping, amounted to NOK 78 billion at the end of February 2010. The loans account for 7.9 per cent of total loans to industries from Norwegian banks. This industry is unaffected by the change in industry classification, which makes it possible to look at a longer time series for this industry.
Loans to the shipping industry have increased considerably in recent years. From September 2005 to October 2009 the 12-month growth rates were never less than 10 per cent. However, the 12-month growth in February 2010 was -2.6 per cent.
In the period from September 2005 to February 2010, between 58 and 81 per cent of Norwegian banks’ loans to the shipping industry were in foreign currencies. As all data in the balance sheet are converted to Norwegian currency, fluctuations in the Norwegian currency against foreign currencies therefore have an effect on the balance sheet figures concerning these loans.
Real estate activities and shipping, together with the manufacturing industry are often referred to as industries particularly exposed to the business cycles. It is therefore likely that the turbulence in the international financial markets and the dampened international and national economic growth can be used as an explanation for some of the development in these industries.
Decline in loans to service industries
The loans to professional and financial services and businesslike services were reduced by 20.1 and 23.7 per cent respectively from May 2009-February 2010. The growth from January to February 2010 was positive and amounted to 0.3 and 0.6 per cent respectively. Professional and financial services` total loans amounted to NOK 76 billion, while loans to businesslike services amounted to NOK 23 billion. Total loans to these industries accounted for about 10.0 per cent of total loans to Norwegian industries.
New industry classificationThe industry classification in the financial statistics changed in May 2009, as Statistics Norway introduced a new version of the Norwegian industry classification, SIC2007 . This has made comparisons of industrial loans before and after May 2009 difficult for some of the industries. The change in industry classification constitutes more details and possibilities to follow the development in borrowing for the different industries. |
The statistics is now published as Banks and mortgage companies.
Contact
-
Statistics Norway's Information Centre
E-mail: informasjon@ssb.no
tel.: (+47) 21 09 46 42


