Content
Published:
This is an archived release.
Varying growth rate in loans to counties
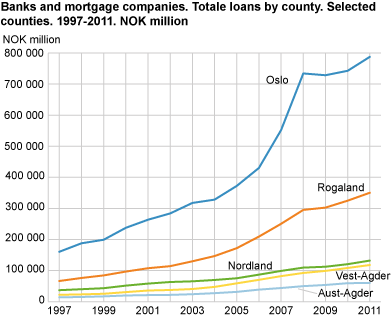
Norwegian banks and mortgage companies’ total loans to counties increased by 6.9 per cent in 2011. The lending growth was strongest in Nordland and weakest in Aust-Agder.
The total loans by county from Norwegian banks and mortgage companies amounted to NOK 3 483 billion at the end of 2011. This is an increase of NOK 225 billion, or 6.9 per cent, in 2011. Nordland had the highest growth with 9.6 per cent, or nearly NOK 12 billion. Vest-Agder followed with an 8.8 per cent growth.
One area had a reduction in total loans from banks and mortgage companies at the end of 2011, namely Svalbard, with a 40.4 per cent decrease in loans compared to 2010.
Growth in loans to households
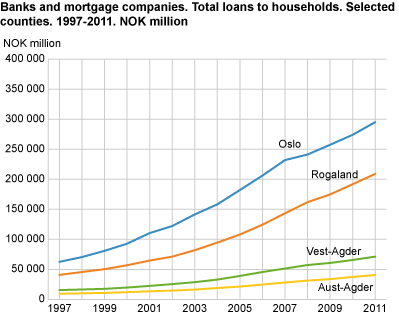
Loans by county from Norwegian banks and mortgage companies to households amounted to NOK 1 976 billion at the end of 2011. This is an increase of NOK 134 billion, or 7.3 per cent, compared to the previous year. Rogaland experienced the highest growth with 8.9 per cent, closely followed by Aust-Agder and Vest-Agder, both with an increase of 8.5 per cent. Households in Svalbard reduced their loans by NOK 42 million, or 19.4 per cent.
The remaining counties had a growth in loans from banks and mortgage companies varying between 4.4 and 7.9 per cent.
Highest lending growth to non-financial corporations in Troms
The total loans from banks and mortgage companies by county to non-financial corporations amounted to NOK 1 037 billion at the end of 2011. This is an increase of NOK 64 billion, or 6.6 per cent, compared to the end of 2010.
In 16 of 19 counties, non-financial corporations increased their volume of loans from banks and mortgage companies. The highest increase in loans was in Troms, with a growth of 16.6 per cent in 2011.
The growth in loans from banks and mortgage companies to non-financial corporations fluctuated between - 7.4 per cent in Aust-Agder to 16.6 per cent in Troms in 2011.
Growth in loans to industries
Total loans from banks and mortgage companies to the different industries amounted to NOK 1 251 billion at the end of 2011. This was an increase of NOK 72 billion, or 6.1 per cent compared to the end of 2010. The real estate, renting and business activity industries held 39 per cent of all the loans, amounting to NOK 792 billion at the end of 2011. This industry is thereby by far the largest of all industries.
Industries within businesslike services increased their loans from banks and mortgage companies by NOK 14 billion, reaching NOK 45 billion at the end of 2011. This implies growth in loans of 43.4 per cent.
Businesslike services held a rather modest share of total loans from banks and mortgage companies by 4 per cent in 2011. This is nonetheless the industry with the highest lending growth of all industries.
High growth rate for mortgage companies
The total loans from mortgage companies to the different industries were NOK 187 billion at the end of 2011. This is an increase of NOK 25 billion, or 15.8 per cent compared to the end of 2010. Transfers of loan portfolios from banks to mortgage companies have contributed to this growth.
Banks’ lending grew more moderately. The growth of NOK 46 billion from NOK 1 018 billion to NOK 1 064 billion in 2011 corresponds to a growth of 4.5 per cent in 2011. The banks’ share of all loans was 77 per cent at the end of 2011.
Finance companies experienced the most moderate lending growth of all financial institutions in 2011, with 2.8 per cent growth in loans to industries.
| Sum loans | Loans to households | Loans to non-financial corporations | |||||||||||||||||||||||||||||||||||||||||||||||||||||||||||||||||||||||||||||
|---|---|---|---|---|---|---|---|---|---|---|---|---|---|---|---|---|---|---|---|---|---|---|---|---|---|---|---|---|---|---|---|---|---|---|---|---|---|---|---|---|---|---|---|---|---|---|---|---|---|---|---|---|---|---|---|---|---|---|---|---|---|---|---|---|---|---|---|---|---|---|---|---|---|---|---|---|---|---|---|
| 2011 | 2010 | Growth | Growth in per cent |
2011 | 2010 | Growth | Growth in per cent |
2011 | 2010 | Growth | Growth in per cent |
||||||||||||||||||||||||||||||||||||||||||||||||||||||||||||||||||||
| Østfold | 140 316 | 134 524 | 5 793 | 4.3 | 97 126 | 91 481 | 5 645 | 6.2 | 30 722 | 31 693 | -971 | -3.1 | |||||||||||||||||||||||||||||||||||||||||||||||||||||||||||||||||||
| Akershus | 353 464 | 326 995 | 26 468 | 8.1 | 250 964 | 233 476 | 17 488 | 7.5 | 80 690 | 71 733 | 8 957 | 12.5 | |||||||||||||||||||||||||||||||||||||||||||||||||||||||||||||||||||
| Oslo | 787 720 | 742 737 | 44 982 | 6.1 | 295 201 | 274 101 | 21 100 | 7.7 | 286 216 | 260 291 | 25 925 | 10.0 | |||||||||||||||||||||||||||||||||||||||||||||||||||||||||||||||||||
| Hedmark | 94 745 | 88 470 | 6 275 | 7.1 | 61 713 | 58 054 | 3 659 | 6.3 | 20 831 | 19 829 | 1 002 | 5.1 | |||||||||||||||||||||||||||||||||||||||||||||||||||||||||||||||||||
| Oppland | 81 434 | 76 548 | 4 886 | 6.4 | 58 088 | 54 869 | 3 219 | 5.9 | 15 314 | 14 699 | 615 | 4.2 | |||||||||||||||||||||||||||||||||||||||||||||||||||||||||||||||||||
| Buskerud | 154 139 | 142 073 | 12 066 | 8.5 | 97 909 | 91 545 | 6 364 | 7.0 | 44 859 | 40 343 | 4 516 | 11.2 | |||||||||||||||||||||||||||||||||||||||||||||||||||||||||||||||||||
| Vestfold | 129 698 | 122 088 | 7 610 | 6.2 | 94 920 | 89 381 | 5 539 | 6.2 | 25 283 | 24 208 | 1 075 | 4.4 | |||||||||||||||||||||||||||||||||||||||||||||||||||||||||||||||||||
| Telemark | 79 851 | 74 158 | 5 693 | 7.7 | 57 503 | 53 619 | 3 884 | 7.2 | 13 454 | 12 323 | 1 131 | 9.2 | |||||||||||||||||||||||||||||||||||||||||||||||||||||||||||||||||||
| Aust-Agder | 60 305 | 59 502 | 803 | 1.4 | 40 633 | 37 461 | 3 172 | 8.5 | 12 960 | 13 992 | -1 032 | -7.4 | |||||||||||||||||||||||||||||||||||||||||||||||||||||||||||||||||||
| Vest-Agder | 118 029 | 108 470 | 9 559 | 8.8 | 71 256 | 65 691 | 5 565 | 8.5 | 34 762 | 31 812 | 2 950 | 9.3 | |||||||||||||||||||||||||||||||||||||||||||||||||||||||||||||||||||
| Rogaland | 350 465 | 324 989 | 25 476 | 7.8 | 208 958 | 191 840 | 17 118 | 8.9 | 115 827 | 115 347 | 480 | 0.4 | |||||||||||||||||||||||||||||||||||||||||||||||||||||||||||||||||||
| Hordaland | 353 210 | 330 958 | 22 251 | 6.7 | 201 076 | 187 832 | 13 244 | 7.1 | 125 100 | 114 965 | 10 135 | 8.8 | |||||||||||||||||||||||||||||||||||||||||||||||||||||||||||||||||||
| Sogn og Fjordane | 60 724 | 57 234 | 3 490 | 6.1 | 31 840 | 29 623 | 2 217 | 7.5 | 19 871 | 19 141 | 730 | 3.8 | |||||||||||||||||||||||||||||||||||||||||||||||||||||||||||||||||||
| Møre og Romsdal | 192 234 | 181 228 | 11 006 | 6.1 | 95 929 | 88 958 | 6 971 | 7.8 | 78 281 | 75 588 | 2 693 | 3.6 | |||||||||||||||||||||||||||||||||||||||||||||||||||||||||||||||||||
| Sør-Trøndelag | 204 462 | 189 770 | 14 692 | 7.7 | 114 195 | 106 691 | 7 504 | 7.0 | 51 211 | 52 807 | -1 596 | -3.0 | |||||||||||||||||||||||||||||||||||||||||||||||||||||||||||||||||||
| Nord-Trøndelag | 64 075 | 59 923 | 4 152 | 6.9 | 41 782 | 38 724 | 3 058 | 7.9 | 13 454 | 13 365 | 89 | 0.7 | |||||||||||||||||||||||||||||||||||||||||||||||||||||||||||||||||||
| Nordland | 132 248 | 120 682 | 11 566 | 9.6 | 79 707 | 75 040 | 4 667 | 6.2 | 37 626 | 32 716 | 4 910 | 15.0 | |||||||||||||||||||||||||||||||||||||||||||||||||||||||||||||||||||
| Troms | 89 971 | 84 001 | 5 971 | 7.1 | 54 345 | 52 054 | 2 291 | 4.4 | 23 412 | 20 074 | 3 338 | 16.6 | |||||||||||||||||||||||||||||||||||||||||||||||||||||||||||||||||||
| Finnmark | 34 935 | 32 275 | 2 660 | 8.2 | 22 797 | 21 416 | 1 381 | 6.4 | 6 368 | 6 153 | 215 | 3.5 | |||||||||||||||||||||||||||||||||||||||||||||||||||||||||||||||||||
| Others1 | 1 194 | 2 002 | -808 | -40.4 | 175 | 217 | -42 | -19.4 | 942 | 1 734 | -792 | -45.7 | |||||||||||||||||||||||||||||||||||||||||||||||||||||||||||||||||||
| Total | 3 483 219 | 3 258 627 | 224 591 | 6.9 | 1 976 117 | 1 842 073 | 134 044 | 7.3 | 1 037 183 | 972 813 | 64 370 | 6.6 | |||||||||||||||||||||||||||||||||||||||||||||||||||||||||||||||||||
| 1 | Svalbard, Jan Mayen and the Norwegian continental shelf. |
|
These statistics give loans and deposits by county and industry. County is determined by the borrower’s and depositor’s home/business address. |
Non-financial corporationsCentral government enterprises, state enterprises, local government enterprises, other municipal enterprises, private incorporated enterprises, e.g. limited companies and private non-profit institutions serving enterprises.
HouseholdsQuasi-corporate private enterprises e.g. partnerships, private non-profit institutions serving households, unincorporated private enterprises, employees, pensioners, social security recipients and students. |
Tables
The statistics is now published as Banks and mortgage companies.
Contact
-
Statistics Norway's Information Centre
E-mail: informasjon@ssb.no
tel.: (+47) 21 09 46 42


