Content
Published:
This is an archived release.
Growth in almost all counties
Total loans by county from Norwegian banks and mortgage companies increased by 4.8 per cent in 2010. All counties experienced an increase, except Svalbard and Sør-Trøndelag.
Total loans by county from Norwegian banks and mortgage companies amounted to NOK 3 259 billion at the end of 2010. This is an increase of NOK 150 billion, or 4.8 per cent, since the end of 2009. Nord-Trøndelag had the highest growth with 12.4 per cent, or NOK 6.6 billion. Aust-Agder followed with a 10.6 per cent growth, and Vest-Agder, Sogn og Fjordane and Akershus all experienced a growth around 9.5 per cent. There were only two counties that had a decrease in total loans from banks and mortgage companies in 2010. These were Svalbard and Sør-Trøndelag, with a 13.1 and 4.8 per cent decrease respectively.
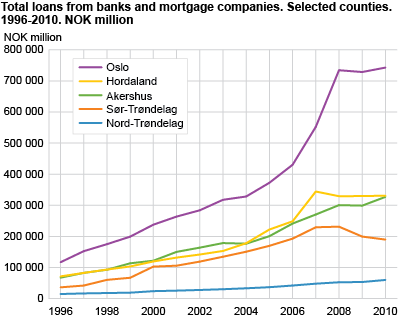
Loans to financial corporations responsible for the decrease in Sør-Trøndelag
The decrease in Sør-Trøndelag of 4.8 was caused by a decrease in loans to financial corporations. These loans were reduced by NOK 21 billion, a total of 54.1 per cent, compared to the end of 2009.
Strongest growth in loans to households in Aust-Agder
Total loans by county to households from banks and mortgage companies amounted to NOK 1 842 billion at the end of 2010. This is an increase of NOK 132 billion, or 7.7 per cent, compared to the end of 2009. Loans to households increased in almost all counties. Aust-Agder had the highest growth with 11 per cent, closely followed by Finnmark and Rogaland with a growth of 9.8 and 9.7 per cent respectively. Svalbard experienced a decline in total loans of just over NOK 200 million during 2010. This equals a decrease of 52.1 per cent, which is the lowest growth among the counties. The rest of the counties had a growth in loans to households between 6.4 and 8.8 per cent in 2010.
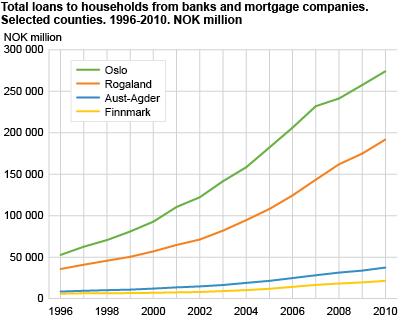
The mortgage companies are solely responsible for the increase in loans to households in all but four counties. These four counties are Telemark, Rogaland, Sør-Trøndelag and Nord-Trøndelag. Figures for banks in isolation show a decrease in all counties except in those mentioned above, while the figures for the mortgage companies show strong growth, between 17.4 and 118.6 per cent, in all counties. As many as 13 counties experienced a growth higher than 31 per cent. The reason for this situation is that large portfolios of loans to households are moved from banks to mortgage companies. This is done in order to get favourable funding which only the mortgage companies have access to (covered bonds). As a consequence of the large portfolio movements of loans from banks to mortgage companies, these two credit institutions should be considered together in order to give an accurate picture of the growth in loans.
Growth in loans to non-financial corporations in all counties
Total loans by county to non-financial corporations from banks and mortgage companies amounted to NOK 973 billion at the end of 2010. This is an increase of NOK 56.5 billion, or 6.2 per cent, from the end of 2009. Finnmark had the strongest growth with 17 per cent, and an additional six counties had a growth of over 12 per cent in loans to non-financial corporations. These were; Akershus, Hedmark, Vest-Agder, Hordaland, Nord-Trøndelag and Troms, with a growth between 12.5 and 15.7 per cent. In Oppland, Aust-Agder, Sogn og Fjordane and Sør-Trøndelag the growth was between 8.5 and 9.7 per cent. Oslo experienced the lowest positive growth of 0.5 per cent.
| Sum loans | Loans to households | Loans to non-financial corporations | |||||||||||||||||||||||||||||||||||||||||||||||||||||||||||||||||||||||||||||
|---|---|---|---|---|---|---|---|---|---|---|---|---|---|---|---|---|---|---|---|---|---|---|---|---|---|---|---|---|---|---|---|---|---|---|---|---|---|---|---|---|---|---|---|---|---|---|---|---|---|---|---|---|---|---|---|---|---|---|---|---|---|---|---|---|---|---|---|---|---|---|---|---|---|---|---|---|---|---|---|
| 2010 | 2009 | Growth | Growth in per cent | 2010 | 2009 | Growth | Growth in per cent | 2010 | 2009 | Growth | Growth in per cent | ||||||||||||||||||||||||||||||||||||||||||||||||||||||||||||||||||||
| østfold | 134 524 | 125 739 | 8 785 | 7.0 | 91 481 | 85 654 | 5 827 | 6.8 | 31 693 | 30 620 | 1 073 | 3.5 | |||||||||||||||||||||||||||||||||||||||||||||||||||||||||||||||||||
| Akershus | 326 995 | 298 871 | 28 124 | 9.4 | 233 476 | 216 236 | 17 240 | 8.0 | 71 733 | 63 730 | 8 003 | 12.6 | |||||||||||||||||||||||||||||||||||||||||||||||||||||||||||||||||||
| Oslo | 742 737 | 728 508 | 14 229 | 2.0 | 274 100 | 257 499 | 16 601 | 6.4 | 260 291 | 258 882 | 1 409 | 0.5 | |||||||||||||||||||||||||||||||||||||||||||||||||||||||||||||||||||
| Hedmark | 88 471 | 81 831 | 6 640 | 8.1 | 58 054 | 54 428 | 3 626 | 6.7 | 19 829 | 17 518 | 2 311 | 13.2 | |||||||||||||||||||||||||||||||||||||||||||||||||||||||||||||||||||
| Oppland | 76 546 | 70 918 | 5 628 | 7.9 | 54 861 | 50 887 | 3 974 | 7.8 | 14 705 | 13 478 | 1 227 | 9.1 | |||||||||||||||||||||||||||||||||||||||||||||||||||||||||||||||||||
| Buskerud | 142 073 | 134 998 | 7 075 | 5.2 | 91 545 | 84 849 | 6 696 | 7.9 | 40 343 | 40 110 | 233 | 0.6 | |||||||||||||||||||||||||||||||||||||||||||||||||||||||||||||||||||
| Vestfold | 122 088 | 114 698 | 7 390 | 6.4 | 89 381 | 83 764 | 5 617 | 6.7 | 24 208 | 23 033 | 1 175 | 5.1 | |||||||||||||||||||||||||||||||||||||||||||||||||||||||||||||||||||
| Telemark | 74 157 | 68 315 | 5 842 | 8.6 | 53 620 | 49 280 | 4 340 | 8.8 | 12 323 | 11 627 | 696 | 6.0 | |||||||||||||||||||||||||||||||||||||||||||||||||||||||||||||||||||
| Aust-Agder | 59 505 | 53 822 | 5 683 | 10.6 | 37 464 | 33 766 | 3 698 | 11.0 | 13 992 | 12 895 | 1 097 | 8.5 | |||||||||||||||||||||||||||||||||||||||||||||||||||||||||||||||||||
| Vest-Agder | 108 472 | 99 022 | 9 450 | 9.5 | 65 693 | 60 700 | 4 993 | 8.2 | 31 812 | 27 537 | 4 275 | 15.5 | |||||||||||||||||||||||||||||||||||||||||||||||||||||||||||||||||||
| Rogaland | 324 990 | 302 624 | 22 366 | 7.4 | 191 840 | 174 816 | 17 024 | 9.7 | 115 347 | 110 283 | 5 064 | 4.6 | |||||||||||||||||||||||||||||||||||||||||||||||||||||||||||||||||||
| Hordaland | 330 959 | 329 640 | 1 319 | 0.4 | 187 832 | 175 569 | 12 263 | 7.0 | 114 965 | 99 376 | 15 589 | 15.7 | |||||||||||||||||||||||||||||||||||||||||||||||||||||||||||||||||||
| Sogn og Fjordane | 57 237 | 52 265 | 4 972 | 9.5 | 29 626 | 27 312 | 2 314 | 8.5 | 19 141 | 17 447 | 1 694 | 9.7 | |||||||||||||||||||||||||||||||||||||||||||||||||||||||||||||||||||
| Møre og Romsdal | 181 228 | 171 539 | 9 689 | 5.6 | 88 958 | 81 556 | 7 402 | 9.1 | 75 588 | 73 942 | 1 646 | 2.2 | |||||||||||||||||||||||||||||||||||||||||||||||||||||||||||||||||||
| Sør-Trøndelag | 189 770 | 199 433 | -9 663 | -4.8 | 106 691 | 99 533 | 7 158 | 7.2 | 52 807 | 48 553 | 4 254 | 8.8 | |||||||||||||||||||||||||||||||||||||||||||||||||||||||||||||||||||
| Nord-Trøndelag | 59 923 | 53 336 | 6 587 | 12.4 | 38 724 | 36 026 | 2 698 | 7.5 | 13 365 | 11 884 | 1 481 | 12.5 | |||||||||||||||||||||||||||||||||||||||||||||||||||||||||||||||||||
| Nordland | 120 682 | 112 431 | 8 251 | 7.3 | 75 040 | 69 304 | 5 736 | 8.3 | 32 716 | 30 781 | 1 935 | 6.3 | |||||||||||||||||||||||||||||||||||||||||||||||||||||||||||||||||||
| Troms Romsa | 84 001 | 78 451 | 5 550 | 7.1 | 52 054 | 48 925 | 3 129 | 6.4 | 20 074 | 17 566 | 2 508 | 14.3 | |||||||||||||||||||||||||||||||||||||||||||||||||||||||||||||||||||
| Finnmark Finnmárku | 32 275 | 29 620 | 2 655 | 9.0 | 21 416 | 19 512 | 1 904 | 9.8 | 6 153 | 5 257 | 896 | 17.0 | |||||||||||||||||||||||||||||||||||||||||||||||||||||||||||||||||||
| Others1 | 2 002 | 2 303 | -301 | -13.1 | 217 | 453 | -236 | -52.1 | 1 734 | 1 795 | -61 | -3.4 | |||||||||||||||||||||||||||||||||||||||||||||||||||||||||||||||||||
| Total | 3 258 635 | 3 108 364 | 150 271 | 4.8 | 1 842 073 | 1 710 069 | 132 004 | 7.7 | 972 819 | 916 314 | 56 505 | 6.2 | |||||||||||||||||||||||||||||||||||||||||||||||||||||||||||||||||||
| 1 | Svalbard, Jan Mayen and Kontinentalsokkelen. |
|
These statistics give loans and deposits by county. County is determined by the borrower's and depositor's home/business address. |
Non-financial corporationsCentral government enterprises, state enterprises, local government enterprises, other municipal enterprises, private incorporated enterprises, e.g. limited companies and private non-profit institutions serving enterprises. |
HouseholdsQuasi-corporate private enterprises e.g. partnerships, private non-profit institutions serving households, unincorporated private enterprises, employees, pensioners, social security recipients and students. |
The statistics is now published as Banks and mortgage companies.
Contact
-
Statistics Norway's Information Centre
E-mail: informasjon@ssb.no
tel.: (+47) 21 09 46 42