Content
Published:
This is an archived release.
Sharp increase in loans to “other service activities”
Bank loans to private education increased from NOK 540 million to NOK 2885 million from 1996 to 2006, while loans to private health and social services increased from NOK 1642 million to NOK 7751 million in the same period.
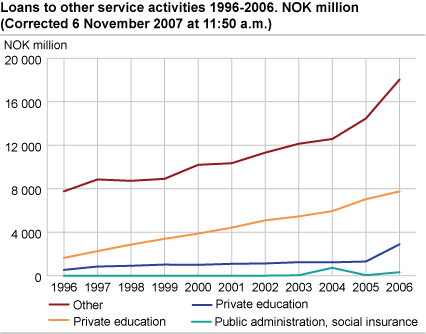
Bank loans to other service activities accounted for about 4 per cent of total bank loans to the non- financial sector, but this industry has had the strongest growth over the last ten years. Loans to other services have tripled since 1996.
There has been a sharp growth in bank loans over the last ten years. The development in bank loans varies considerably between different industries, however. Business activities and real estate business is the largest borrowing industry, accounting for 56 per cent of total bank loans to non-financial enterprises at the end of 2006.
Bank loans to business activities, real estate and financial industries amounted to NOK 391 billion at the end of 2006, up from NOK 92.3 billion in 1996. The annual statistics for banks show that loans to real estate accounted for more than 77 per cent of total bank loans to business activities and real estate industry at the end of 2006. These figures were also commented on in the published monthly statistics for May .
|
Loans to non-financial enterprises are reported disaggregated on different industries both on a monthly and annual basis, but on different aggregation levels. The monthly statistics have nine different aggregated industries, while the annual statistics are more detailed with about 45 different industries. This publication is based on final figures for 2006 for loans and deposits by industry and county. Preliminary figures were published in June. |
The statistics is now published as Banks and mortgage companies.
Contact
-
Statistics Norway's Information Centre
E-mail: informasjon@ssb.no
tel.: (+47) 21 09 46 42