Content
Published:
This is an archived release.
Continued decrease in sickness absence
Sickness absence decreased from 7 to 6.5 per cent from the fourth quarter of 2010 to the fourth quarter of 2011; a decrease of 7.6 per cent.
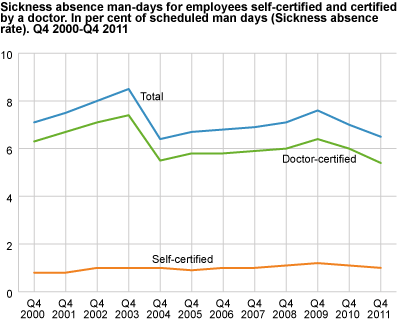
Doctor-certified sickness absence decreased from 6 to 5.4 per cent - a fall of 8.5 per cent. Self-certified sickness absence dropped 2.6 per cent, from 1.1 to 1 per cent.
Sickness absence in the fourth quarter of 2011 was 13.6 per cent lower than in the fourth quarter of 2001, when the agreement on an inclusive labour market was implemented for the first time.
Strongest decrease for men
Sickness absence for men decreased from 5.5 to 5 per cent. The absence for women decreased from 9.4 to 8.3 per cent; a fall of 9.4 and 6 per cent respectively.
Solid decrease in the construction industry
All industries had a fall in sickness absence. Amongst the major ones, the construction and administrative, support service industries had the strongest decreases, of 15.9 and 11 per cent respectively.
Strongest decrease in private sector
Sickness absence dropped in all sectors. The private sector had the strongest decrease, of 9.5 per cent. In local government, the absence fell by 4.5 per cent while the absence in central government (including health enterprises) dropped by 3.9 per cent.
Decrease in all age groups
The doctor-certified absence fell in all age groups below 66 years. The strongest reduction was within the age groups 20-29 years, with the strongest decrease amongst the age group 20-24 years by 12.3 per cent.
Within the different age groups by gender, all of the five-year age groups for men between 20 and 49 years had a decline in sickness absence of more than 10 per cent. For women, only the age groups 20-24 and 25-29 had a decrease of more than 10 per cent.
These results are based on data on sickness absence certified by a doctor, as the survey on self-certified absence does not contain data on sickness absence by age.
Sickness absence by new industry classification dating back to 2000Since the figures were published for the first quarter of 2009, a new industry classification has been introduced. These will give a break in the time series for the figures by industry. Statistics Norway has calculated figures according to the new industry classification dating back to 2000. We refer to tables 3 and 33 under “ More tables ”. Sickness absence according to the Labour force survey dating back to 1972The sickness absence statistics give figures dating back to the second quarter of 2000. For longer time series we must use other data sources, for instance the Labour force survey (LFS). Tables for sickness absence according to LFS dating back to 1972 (total figures) and 1979 (men/women) are now available in StatBank . |
Technical informationRates of change The sickness absence rates are presented using one decimal point. More decimal points are used when calculating the rates of change in order to get more accurate figures. These will therefore differ slightly from the rates of change produced when using the published rounded figures. The statistics do not cover self-employed persons. |
Tables:
- Table 1 Sickness absence man-days for employees self-certified and certified by a doctor. In per cent of scheduled man-days (Sickness absence rate). Quarterly figures. 2000-2010
- Table 2 Sickness absence man-days for employees self-certified and certified by a doctor, by sex. In per cent of scheduled man-days (Sickness absence rate). Quarterly figures. 2000-2010
- Table 28 Sickness absence by type of absence(self-certified or doctor-certified) and duration within the quarter
Contact
-
Arbeidsmarked og lønn
E-mail: arbeidsmarked@ssb.no
-
Unn H. Høydahl
E-mail: unnh.hoydahl@ssb.no
tel.: (+47) 40 90 23 77