Content
Published:
This is an archived release.
Increase in sickness absence
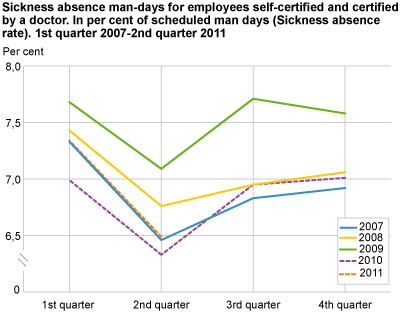
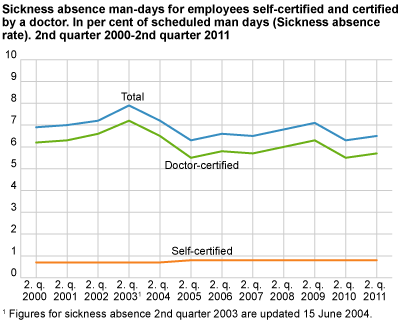
Sickness absence increased from 6.3 to 6.5 per cent from the second quarter of 2010 to the second quarter of 2011; an increase of 2.5 per cent.
Doctor-certified sickness absence rose from 5.5 to 5.7 per cent, and came mainly among women. Self-certified sickness remained unchanged at 0.8 per cent.
Sickness absence in the second quarter of 2011 was 7.1 per cent lower than in the first quarter of 2001, the first year of implementation of the agreement on an inclusive labour market.
Increase in doctor-certified absence for women
Doctor-certified sickness absence for women increased from 8 to 8.3 per cent; an increase of 4.2 per cent. Doctor-certified sickness absence for men remained unchanged at 5 per cent.
Strongest increase in public industries
Among the major industries, the public administration and education had the strongest increases, by 8.3 and 7 per cent respectively. The sickness absence levels for these industries are still below the average.
Smallest increase in private sectors
Sickness absence rose in all of the sectors. Central government (including health enterprises) and local government had the strongest increase by 5.7 per cent. The absence in private sector increased by 0.7 per cent.
The sickness absence level was lowest in the private sector, with 6 per cent, and highest in local government, with 8.2 per cent.
Decrease for the youngest age groups
The doctor-certified absence amongst the youngest age-groups (below 25 years) had the strongest decrease by 4.9 per cent. The reduction for men and women in these age groups were 6.6 and 3.5 per cent respectively.
The female age groups 55-59 and 60-64 years had the strongest increase, by 8.9 and 7.4 per cent respectively.
For men, the age group 55-59 and 50-54 years had the strongest increase amongst the largest age groups by 3.8 and 2.9 per cent respectively.
These results are based on data on sickness absence certified by a doctor, as the survey on self-certified absence does not contain data on sickness absence by age.
Sickness absence by new industry classification dating back to the year 2000From the figures published for the first quarter of 2009, a new industry classification is in use. These will give a break in the time series for the figures by industry. Statistics Norway has calculated figures according to the new industry classification dating back to the year 2000. We refer to tables 3 and 33 under “ More tables ”.
Sickness absence according to the Labour Force Survey dating back to the year 1972The sickness absence statistics give figures dating back to the second quarter of 2000. For longer time series we must use other data sources, for instance the Labour Force Survey (LFS). Tables for sickness absence according to LFS dating back to 1972 (total figures) and 1979 (men/women) are now available in StatBank . |
Technical informationRates of change The sickness absence rates are presented using one decimal point. More decimal points are used when calculating the rates of change in order to get more accurate figures. These will therefore differ somewhat from the rates of change produced when using the published rounded figures.
The statistics do not cover self-employed persons. |
Tables:
- Table 1 Sickness absence man-days for employees self-certified and certified by a doctor. In per cent of scheduled man-days (Sickness absence rate). Quarterly figures. 2000-2010
- Table 2 Sickness absence man-days for employees self-certified and certified by a doctor, by sex. In per cent of scheduled man-days (Sickness absence rate). Quarterly figures. 2000-2010
- Table 28 Sickness absence, by type of absence(self-certified or doctor-certified) and duration within the quarter
- Table 34 Cases of sickness absence and sickness absence man-days, self-certified and doctor-certified absence, by sex and duration. Per cent. Quarterly figures. 2010-2011
Contact
-
Arbeidsmarked og lønn
E-mail: arbeidsmarked@ssb.no
-
Unn H. Høydahl
E-mail: unnh.hoydahl@ssb.no
tel.: (+47) 40 90 23 77