Content
Published:
This is an archived release.
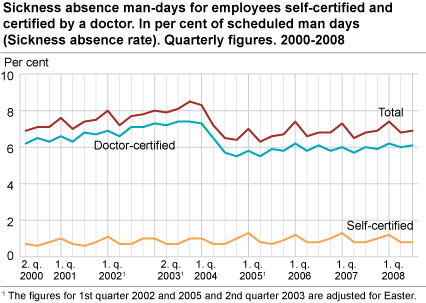
Small increase in sickness absence
The sickness absence rose from 6.8 to 6.9 per cent from the third quarter of 2007 to the third quarter of 2008. The increase came from absence certified by a doctor.
The sickness absence for women increased from 8.4 to 8.5 per cent, while it remained stable at 5.6 per cent for men.
The sickness absence in the third quarter of 2008 was 7.4 per cent lower than in the third quarter of 2001, the year of the implementation of the agreement on an inclusive labour market.
Clear growth in financial intermediation
While the growth in the total sickness absence (self-certified and doctor-certified) was 1 per cent last year, the increase in financial intermediation was 9.5 per cent. The level at 5.3 per cent is however still lower than the average for all industries.
Among the larger industries, the growth was largest in manufacturing and mining and domestic trade, hotels and restaurants, with increases of 3.3 and 5.4 per cent respectively. From the third quarter of 2007 to the third quarter of 2008, the sickness absence declined by 6.1 per cent in real estate and business activities and by 0.5 per cent in public administration .
Increased proportion of long-lasting absence
The proportion of sickness absence certified by doctor and lasting for more than 31 days rose from 61.5 per cent to 62.3 per cent from the third quarter of 2007 to the third quarter of 2008. The proportion of self-certified sickness absence compared to the total sickness absence fell from 11.2 to 10.9 per cent.
Decrease in central government
The sickness absence in central government (including health enterprises) decreased by 1.4 per cent. Within central government the sickness absence in the education sector (universities and university colleges) decreased by 2.2 per cent, while sickness absence in the health care sector (mainly health enterprises) fell by 1.7 per cent.
In local government the sickness absence remained unchanged. The sickness absence in the health care sector fell by 1.1 per cent, while it rose by 1.4 per cent in the education sector (primary and secondary education).
The sickness absence increased by 1.9 per cent in the private sector and public enterprises. This sector has, together with central government, the lowest sickness absence level, 6.6 per cent. Highest sickness absence has local government with 8.1 per cent.
Continued increase in the sickness absence amongst the youngest
The tendency of the last years with growth in doctor-certified sickness absence among persons below 30 years, also continued this quarter. From the third quarter of 2007 to the third quarter of 2008 the sickness absence rose by 4.3 per cent among 20-24 years-olds. The level among the youngest age-groups is however still lower than the average. These results are based on data on sickness absence certified by a doctor, as the survey on self-certified absence does not contain data on sickness absence by age.
Technical informationSickness absence rate The sickness absence rate measures man-days lost due to own sickness as a percentage of scheduled man-days. Rates of change The sickness absence rates are presented using one decimal point. When we calculate the rates of change, we use more decimals in order to get more accurate figures. These will therefore differ somewhat from the rates of change produced when using the published rounded figures. The statistics do not cover self - employed persons . |
Tables:
- Table 1 Sickness absence man-days for employees self-certified and certified by a doctor. In per cent of scheduled man-days (Sickness absence rate). Quarterly figures. 2000-2008
- Table 2 Sickness absence man-days for employees self-certified and certified by a doctor, by sex. In per cent of scheduled man-days (Sickness absence rate). Quarterly figures. 2000-2008
- Table 3 Sickness absence man-days for employees self-certified and certified by a doctor, by industry and type of sickness absence. In per cent of scheduled man days (Sickness absence rate). Quarterly figures. 2000-2008
- Table 28 Sickness absence by type of absence (self-certified or doctor-certified) and duration within the quarter
- Table 33 Change in per cent of the sickness absence rate for employees self-certified and certified by a doctor, by industry and type of sickness absence. Quarterly changes. 2000-2008
Tables
Contact
-
Arbeidsmarked og lønn
E-mail: arbeidsmarked@ssb.no
-
Unn H. Høydahl
E-mail: unnh.hoydahl@ssb.no
tel.: (+47) 40 90 23 77

