Content
Published:
This is an archived release.
Continued increase among male immigrants
Only men experienced a growth in the unemployment rate from August 2014 to August 2015, both among immigrants and within the rest of the population.
| 3rd quarter 2015 | Change last twelve months | |||
|---|---|---|---|---|
| Absolute figures | Per cent | 3rd quarter 2014 - 3rd quarter 2015 | ||
| Absolute figures | Percentage points | |||
| 1Non-residents included. | ||||
| 2Turkey is included. | ||||
| Registered unemployed, total | 84 701 | 3.1 | 5 777 | 0.2 |
| Non-immigrant population1 | 53 512 | 2.3 | 3 432 | 0.1 |
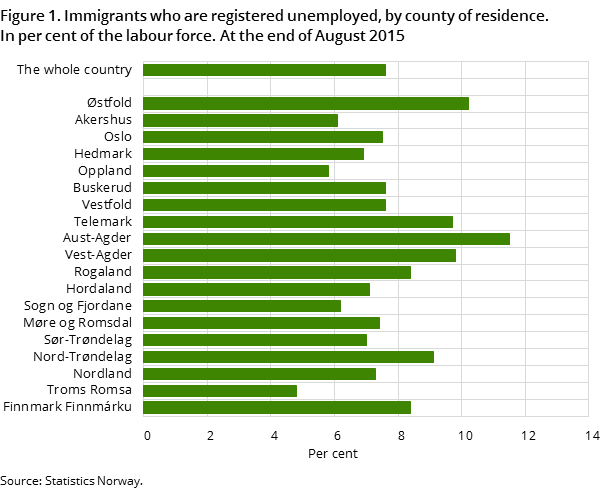
| Immigrants, total | 31 189 | 7.6 | 2 345 | 0.4 |
| The Nordic countries | 1 614 | 3.3 | 122 | 0.3 |
| Western Europe else | 1 834 | 4.1 | 386 | 0.8 |
| EU countries in Eastern Europe | 10 626 | 8.6 | 1 683 | 1.2 |
| Eastern Europe else | 2 532 | 7.3 | 25 | -0.1 |
| North-America and Oceania | 256 | 3.9 | 21 | 0.3 |
| Asia2 | 8 639 | 8.3 | 62 | -0.1 |
| Africa | 4 576 | 12.5 | -74 | -1.5 |
| South- and Central-Amerika | 1 112 | 8.4 | 120 | 0.8 |

The registered unemployment among male immigrants has increased over the past year from 6.6 to 7.3 per cent. Among men in the rest of the population, unemployment rose from 2.2 to 2.5 per cent. Among immigrant women, the unemployment rate decreased by 0.2 percentage points to 7.8 per cent in August 2015, while remaining stable among women in the rest of the population, at 2.1 per cent.
In total, 84 700 people were registered as unemployed in the 3rd quarter of 2015. Of these, about 31 200 were immigrants, which is a share of 37 per cent of the total unemployed. This share was almost the same in August 2014.
Unemployment went up among EU immigrants and down among the Africans
The changes in the unemployment rate from August 2014 to August 2015 varied considerably within the immigrant groups. Immigrants from EU countries in the east had the strongest growth at 1.2 percentage points, while those from Western Europe and Latin America both had increases of 0.8 percentage points. On the other hand, immigrants from Africa had a decrease of 1.5 percentage points.
Otherwise, there were only small changes within the remaining groups.
African immigrants still have the highest unemployment
Despite the decrease in the unemployment rate, immigrants from Africa still have the highest unemployment level, at 12.5 per cent in the 3rd quarter, which is due to the large share of refugees within this group. This rate was followed by immigrants from EU countries in the east, with 8.6 per cent unemployed. The groups from Latin America and Asia are also close to that level, with rates of 8.4 and 8.3 per cent respectively, while those from Eastern Europe outside the EU had 7.3 per cent unemployed.
Despite the increase, the rates among the remaining groups were, as usual, far below the immigrant average. Among immigrants from Western Europe, unemployment was 4.1 per cent, and among those from North America and Oceania the figure was 3.9 per cent. Immigrants from the Nordic countries had the lowest rate, as usual, at 3.3 per cent.
Increase among participants on labour market schemes
Just over 1 000 more immigrants took part in labour market schemes in August 2015 than in August 2014, which is an increase of 35 per cent within this participant group. Among participants in total, the growth was 39 per cent. A total of 3 992 immigrants took part in labour market schemes in the 3rd quarter of 2015, making up 44 per cent of the total participant group. As in previous years, the majority of the immigrant participants were from Asia and Africa.
Lower unemployment among Norwegian-born to immigrant parents than immigrants
Norwegian-born to immigrant parents is still a rather small group of unemployed. This group constituted 1 178 registered unemployed in the 3rd quarter of 2015. A large share of this group is aged 15-29 years, and the unemployment rate within this age group was 4.7 per cent, which was 3.1 percentage points below the immigrant group at the same age (at 7.8 per cent) and 1.4 percentage points higher than the corresponding age group in the rest of the population (at 3.3 per cent).
The unemployment rate decreased within all three population groups aged 15-29 years. The decline was strongest among Norwegian-born to immigrant parents by 0.6 percentage points, while immigrants and the rest of the population had declines of 0.2 and 0.4 percentage points within this age group.
Additional information
The unemployment figures are based on the Norwegian Labour and Welfare Organisation’s register of jobseekers and are calculated as a share of the labour force, which is the sum of employed persons and registered unemployed persons, i.e. people offering their labour on the labour market.
Contact
-
Statistics Norway's Information Centre
E-mail: informasjon@ssb.no
tel.: (+47) 21 09 46 42
