Content
Published:
This is an archived release.
More unemployed, fewer on labour market schemes
The number of registered unemployed immigrants settled in Norway increased by 2 350 from August 2013 to August 2014. In the same period, the number of participants on labour market schemes fell by 2 600.
| 3rd quarter 2014 | Change last twelve months | |||
|---|---|---|---|---|
| Absolute figures | Per cent | 3rd quarter 2013 - 3rd quarter 2014 | ||
| Absolute figures | Percentage points | |||
| 1Non-residents included. | ||||
| 2Turkey is included. | ||||
| Registered unemployed, total | 78 924 | 2.9 | 5 401 | 0.2 |
| Non-immigrant population1 | 50 082 | 2.2 | 3 055 | 0.1 |
| Immigrants, total | 28 842 | 7.2 | 2 346 | 0.2 |
| The Nordic countries | 1 510 | 3.0 | 109 | 0.2 |
| Western Europe else | 1 472 | 3.3 | 125 | 0.2 |
| EU countries in Eastern Europe | 8 939 | 7.5 | 1 450 | 0.6 |
| Eastern Europe else | 2 499 | 7.4 | 123 | 0.1 |
| North-America and Oceania | 235 | 3.6 | 61 | 0.9 |
| Asia2 | 8 562 | 8.5 | 82 | -0.3 |
| Africa | 4 641 | 14.1 | 277 | -0.2 |
| South- and Central-Amerika | 984 | 7.7 | 119 | 0.7 |

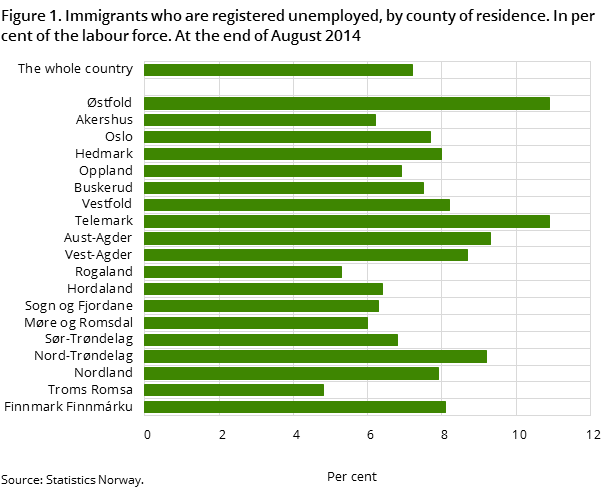
The unemployment rate among immigrants increased from 7.0 per cent in August 2013 to 7.2 per cent in August 2014. In the rest of the population, this rate rose from 2.0 to 2.2 per cent during the same period.
In total, approximately 78 900 persons were registered as unemployed in the 3rd quarter of 2014. Of these, almost 28 800 were immigrants, which is a share of 36.5 per cent of the total unemployed.
In absolute numbers, there were 2 350 more immigrants unemployed in August 2014. Among them, 1 450 came from the EU countries in Eastern Europe, and they were mainly men. The total number of registered unemployed persons increased by 5 400. Hence, immigrants constituted 43.5 per cent of the growth in the unemployment from August 2013 to August 2014.
Large disparities among immigrants
There were rather weak changes in the unemployment rate. Immigrants from North America and Oceania, the smallest group, had the strongest increase of 0.9 percentage points, while unemployment among immigrants from Latin America and the EU countries in Eastern Europe increased by 0.7 and 0.6 percentage points respectively. The Asian and African immigrants had, on the other hand, small decreases of 0.3 and 0.2 percentage points respectively. The remaining groups had a weak increase of 0.2 percentage points each.
As in previous years, immigrants from Africa had the highest unemployment level, at 14.1 per cent. This was followed by immigrants from Asia with 8.5 per cent. Immigrants from Latin America had a rate of 7.7 per cent unemployed, while the Eastern European groups (within and outside EU) had around 7.5 per cent.
The remaining groups had considerably lower rates, as is normally the case. Among immigrants from North America and Oceania the unemployment rate was 3.6 per cent, while those from Western Europe and the Nordic countries had 3.3 and 3.0 per cent registered unemployed respectively.
Male immigrants had an unemployment rate of 6.6 per cent in the 3rd quarter, while the corresponding share for female immigrants was higher, at 8.0 per cent. In the rest of the population, the gender disparity was reversed, with 2.2 per cent for men and 2.1 for women. The growth in the unemployment rate was equal among men and women both within the immigrant group (0.2 percentage points) and the rest of the population (0.1 percentage point).
fig-2014-11-06-01-en; Immigrants who are registered unemployed as a percentage of the labour force by county of residence. At the end of August 2014.
Continued decline among participants on labour market schemes
The decline in the number of participants on labour market schemes continues. From August 2013 to August 2014 there were 2 600 fewer participants among immigrants. Among participants in total, the decrease was almost 5 100.
A total of 2 960 immigrants were participants on labour market schemes in the 3rd quarter of 2014, making up 45 per cent of the total participant group. The majority came from Asia, Africa and the eastern EU countries.
Lower unemployment among Norwegian-born to immigrant parents than immigrants
Norwegian-born to immigrant parents is still a rather small group of unemployed persons despite some growth during the last year. This group constituted slightly more than 1 100 registered unemployed persons in the 3rd quarter of 2014. The majority within this group are aged 15-29 years, and the unemployment rate among them was 5.4 per cent, which was 2.7 percentage points below the immigrant group at the same age (at 8.1 per cent) and 1.8 percentage points higher than the corresponding age group in the rest of the population (at 3.6 per cent).
The unemployment rate among Norwegian-born to immigrant parents and in the majority was unchanged, while immigrants had a slight decrease of 0.2 percentage points during the last year.
Additional information
The unemployment figures are based on the Norwegian Labour and Welfare Organisation’s register of jobseekers and are calculated as a share of the labour force, which is the sum of employed persons and registered unemployed persons, i.e. people offering their labour on the labour market.
Contact
-
Statistics Norway's Information Centre
E-mail: informasjon@ssb.no
tel.: (+47) 21 09 46 42
