Content
Published:
This is an archived release.
Immigrant unemployment declines
Registered unemployment among immigrants decreased from 7.2 per cent in May 2010 to 6.5 per cent in May 2011. In the rest of the population, this rate decreased from 2.2 to 1.9 per cent. The decrease only occurred among men.
|
Immigrants are defined as being born abroad by foreign-born parents, and they are all registered as residents in Norway. Among the registered unemployed, some non-registered residents are also included. These people are settled abroad and are expected to stay in Norway less than six months. This group is not included among the immigrants but is a part of the rest of the population. See the table below on this page for further information. The unemployment figures are based on the Norwegian Labour and Welfare Organisation’s register of jobseekers and are calculated as a fraction of the labour force. Norwegian-born to immigrant parents (previously referred to as “descendants”) are not counted as immigrants. |
| May 2010 | May 2011 |
Change
2010-2011 |
|||||||||||||||||||||||||||||||||||||||||||||||||||||||||||||||||||||||||||||
|---|---|---|---|---|---|---|---|---|---|---|---|---|---|---|---|---|---|---|---|---|---|---|---|---|---|---|---|---|---|---|---|---|---|---|---|---|---|---|---|---|---|---|---|---|---|---|---|---|---|---|---|---|---|---|---|---|---|---|---|---|---|---|---|---|---|---|---|---|---|---|---|---|---|---|---|---|---|---|---|
| Registered unemployed in total | 70 594 | 64 659 | -5 935 | ||||||||||||||||||||||||||||||||||||||||||||||||||||||||||||||||||||||||||||
| Unemployed registered as residents | 69 007 | 63 268 | -5 739 | ||||||||||||||||||||||||||||||||||||||||||||||||||||||||||||||||||||||||||||
| Of which | |||||||||||||||||||||||||||||||||||||||||||||||||||||||||||||||||||||||||||||||
| Immigrants | 20 655 | 20 223 | -432 | ||||||||||||||||||||||||||||||||||||||||||||||||||||||||||||||||||||||||||||
| The rest of the population | 48 352 | 43 045 | -5 307 | ||||||||||||||||||||||||||||||||||||||||||||||||||||||||||||||||||||||||||||
| Unemployed not registered as residents | 1 587 | 1 391 | -196 | ||||||||||||||||||||||||||||||||||||||||||||||||||||||||||||||||||||||||||||
Strongest decrease among immigrants from Eastern EU countries
Immigrants from the EU countries in Eastern Europe had the strongest decrease in the unemployment rate, of 1.8 percentage points from the 2nd quarter of 2010 to the 2nd quarter of 2011, while immigrants from Africa had the next strongest, of 1.1 percentage points. The other immigrant groups had a fall in the unemployment rate approximately the same as the immigrant group as a whole, of 0.7 percentage points. The exception to this was the Asian group, which had an unchanged unemployment rate.
Immigrants from Africa still had the highest level in the second quarter of 2011, at 12.4 per cent. Then came immigrants from Asia with an unemployment rate of 8.2 per cent. Immigrants from the EU countries in Eastern Europe had a rate of 7.4 per cent, those from the remainder of Eastern Europe 6.6 per cent and the group from Latin America 6.3 per cent. As usual, there is a gap to the groups from the Nordic countries and Western Europe, which have considerably lower unemployment rates; 2.5 and 2.9 per cent respectively. The smallest immigrant groups, those from North-America and Oceania, also had a low rate at 2.6 per cent.
The high level of unemployment among Africans is partly due to the dominance of refugees within this group. African immigrants have for several years had the highest registered unemployment rate irrespective of the economic cycles. With regard to the immigrants from the EU countries in Eastern Europe, their unemployment rate is caused by the declining economic cycles and the loss of jobs that many labour immigrants within the construction industry and some manufacturing industries experienced in 2009. However, the activity within these industries is now increasing, and as we have seen, the unemployment rate is falling.
Decrease among men only
Immigrant men had a decline of 1.3 percentage points, while immigrant women experienced a marginal growth in the unemployment rate of 0.1 percentage point. We can also observe the same tendency in the rest of the population; a decline of 0.5 percentage points among men and a slight increase of 0.1 among the women. This tendency is due to the unemployment decrease in the male dominated occupations within construction and manufacturing, while there is some growth in the female dominated occupations in the public sector. However, men still had the highest level of unemployment. In the immigrant group the rate was 6.8 per cent among men and 6.2 among women. In the rest of the population the rates were 2.2 and 1.7 per cent respectively.
Also decrease among Norwegian-born to immigrant parents
Norwegian-born to immigrant parents is still a rather small group of unemployed. This group constituted 766 registered unemployed in May 2011. The majority within this group are aged 15-29 years, and the unemployment rate among them was 5 per cent, which was 1.6 percentage points higher than the corresponding age group in the majority population (at 3.4 per cent), but 2.1 percentage points below the immigrant group at the same age (at 7.1 per cent). Of these three young population groups, the immigrants had the strongest decline, of 0.9 percentage points each, while the Norwegian-born to immigrant parents and the majority had a decline of 0.3 percentage points each.
Fewer unemployed not registered as residents
A total of 1 391 of the unemployed were not registered as residents in Norway in the second quarter of 2011. Of these non-residents, 752 were citizens from the EU countries in Eastern Europe and 271 were from the Nordic countries. The group of unemployed non-residents has decreased by 196 people
since the second quarter of 2010. This constitutes a decline of 12 per cent. As much as 83 per cent of the non-residents in the second quarter of 2011 were men.
Continued decrease among participants on labour market schemes
The number of immigrants on ordinary labour market schemes (job programmes) decreased from
7 672 in May 2010 to 7 402 in May 2011. Among non-immigrants, the number of participants decreased from 11 685 to 10 594 participants. More than 40 per cent of the participants were immigrants. The largest groups among them came from Asia, Africa and EU countries in Eastern Europe. All together they constituted 5 800 participants.
Tables:
- Table 1 Registered unemployed by immigrant background, region of birth and sex. In absolute figures and in per cent of the labour force. By the end of May 2010 and 2011
- Table 2 Participants on ordinary labour market schemes (job programmes), by immigrant background, region of birth and sex. Absolute numbers and in per cent of the population aged 15 to 74 years. By the end of May 2010 and 2011
- Table 3 Registered unemployed, by region of birth and time of residence in Norway. By the end of May 2010 and 2011. Absolute figures and in per cent of the population aged 15-74 years in each group
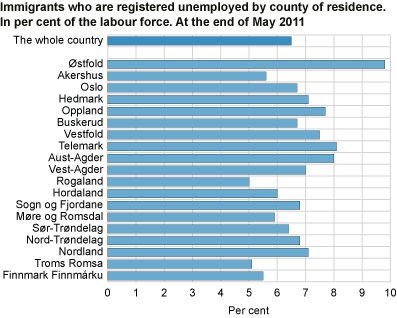
- Table 4 Registered unemployed by immigrant background, region of birth and county of residence. Absolute numbers and in per cent of the labour force in each group. By the end of May 2010 and 2011
- Table 5 Participants on ordinary labour market schemes (job-programmes) by immigrant background, region of birth and county of residence. Absolute numbers and in per cent of the population aged 15 to 74 years in each group. By the end of May 2010 and 2011
- Table 6 Registered unemployed by sex, immigrant background, region of birth and age. Absolute numbers and in per cent of the labour force. By the end of May 2010 and 2011
- Table 7 Unemployed persons not registered as resident, by region of birth and sex. By the end of May 2010 and 2011
- Table 8 Unemployed persons not registered as resident, by region of birth and age. By the end of May 2010 and 2011
Additional information
The unemployment figures are based on the Norwegian Labour and Welfare Organisation’s register of jobseekers and are calculated as a share of the labour force, which is the sum of employed persons and registered unemployed persons, i.e. people offering their labour on the labour market.
Contact
-
Statistics Norway's Information Centre
E-mail: informasjon@ssb.no
tel.: (+47) 21 09 46 42