Content
Published:
Highest immigrant employment in 15 years
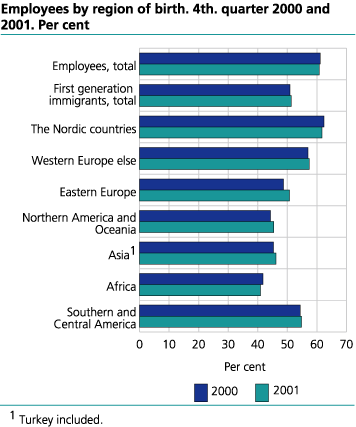
The employee rate among first generation immigrants increased from 50.9 per cent in November 2000 to 51.3 per cent in November 2001. In the entire population this rate decreased from 61.1 to 60.8 per cent in the same period. The immigrant employment is the highest since 1986.
East Europeans had the highest increase from November 2000 to November 2001, of 2 percentage points. Among the other groups of immigrants some smaller changes have been registered in the employee rate last year. The immigrants from North America and Oceania and Asia had an increase of about 1 percentage point while immigrants from Africa had an 1 percentage decrease. Among immigrants from the Nordic countries a slight decrease of 0.7 percentage points was registered.
Highest employment among people from Nordic countries and Western Europe
Immigrants from the Nordic countries and Western Europe had the highest employee rates of 61.7 and 57.4 per cent respectively, while the immigrants from Africa and North America and Oceania had the lowest rates, 40.9 and 45.4 per cent respectively. The number of registered unemployed reveals, however, that the immigrants from North America and Oceania have a low unemployment rate as opposed to the immigrants from Africa who have the highest level of unemployment. They also have a higher proportion of persons above 60 years than other immigrant groups. Among the non-western immigrant groups those from South and Central America had the highest employee rate of 54.8 per cent.
Despite a lower rate of employment among immigrants from non-western regions, immigrants from some non-western countries, however, had an employee rate at the national level, as for instance immigrants from Sri Lanka and Chile, both 61 per cent. Immigrants from the Philippines and India also had a high level of employment, 59.4 and 56.4 per cent respectively.
In total the immigrants with the shortest time of residence in Norway (4 years and less) had the lowest employee rate, 43.0 per cent, while those who have been residents for more than four years had an employee rate of 54.0 per cent. In the non-western groups of immigrants a marked growth seems to occur after seven years of residence. Hence the non-westerners seem to need longer time of residence for establishing themselves on the Norwegian labour market.
In the entire population men had an employee rate of 63.1 per cent while the figure for women was 59.0 per cent. Among immigrants these numbers were 55.3 per cent and 47.2 per cent respectively.
Immigrants from Western Europe had the largest difference in employee rates among men and women, of 13 percentage points in men's favour, while immigrants from the Nordic countries had the
least differences between the sexes, 0.3 percentage points.
Non-westerners overrepresented in hotels, restaurants and industrial cleaning
Non-western immigrants were overrepresented within industries such as hotel and restaurants and industrial cleaning, while the western immigrants had higher shares of employees within industry groups such as extraction of crude petroleum, computer activities and research as opposed to the whole working population.
Self employed not included
The statistics include all first generation immigrants aged 16 - 74 years who are registered as active employees and settled in Norway. Hence, self employed, family workers and conscripts are not included in the statistics.
Tables:
- Table 1 Employees by region of birth, time of residence in Norway and age. In per cent of persons in total aged 16-74 years. 4th quarter 1991, 2000 and 2001
- Table 2 Employees by region of birth, time of residence in Norway and sex. In per cent of persons in total aged 16-74 years. 4th quarter 2001
- Table 3 Employees aged16-74 years by region of birth and selected groups of industry. 4th quarter 2001. Per cent
- Table 4 Employees aged 16-74 years who are first generation immigrants by sex and country of birth. In absolute numbers and per cent by persons in total. 4th. quarter 1991, 2000 and 2001
- Table 5 Employees aged 16-74 years by region of birth and county of residence. 4th. quarter 2001. Per cent
- Table 6 Employees by region of birth and county of residence. In per cent of persons aged 16-74 years. 4th. quarter 2001
The statistics is now published as Employment among immigrants, register-based.
Contact
-
Bjørn Mathisen
E-mail: mat@ssb.no
-
Bjørn Olsen
E-mail: bjorn.olsen@ssb.no
tel.: (+47) 40 90 23 87

