Content
Published:
This is an archived release.
Stable labour market
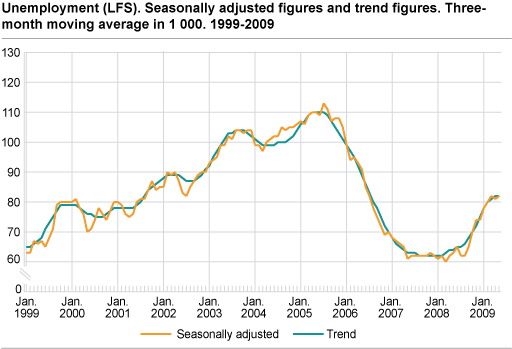
The level of employment and unemployment kept stable from February to May. The unemployment rate was 3.1 per cent of the labour force in May.
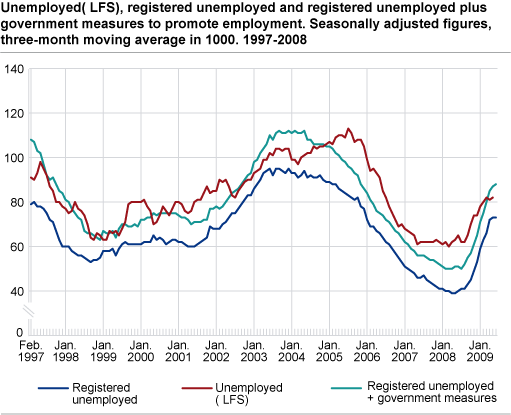
Adjusted for seasonal variations the Labour Force Survey (LFS) shows that the number of unemployment increased by 2.000 people from February (as measured by the average of the three months from January to March) to May (as measured by the average of the three months from April to June). This is within the error margin of the LFS. The unemployment rate was 3.1 percent of the labour force in May, the same as in February.
Seasonally-adjusted figures for those registered unemployed and on government initiatives to promote employment with the Labour and Welfare Organisation (NAV) increased by 11.000 in the same period.
|
NAV reports that 4 700 persons were incorrectly registered unemployed in February 2010. The erroneous figure was lower in previous months, but dates back to October 2008.This has no consequence for the LFS-numbers published by Statistics Norway, only for the comparisons with NAV's figures. Read more on NAV's website, or contact stein.langeland@nav.no |
Unemployment up in other countries
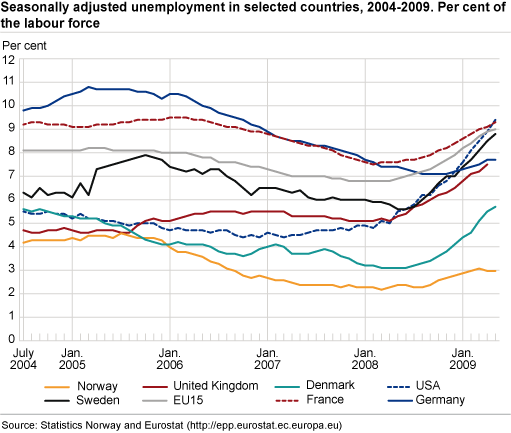
From February to May unemployment continued to rise in the EU countries as well as in the USA. In Sweden the unemployment rate increased from 7.7 percent in February to 8.8 in May, and in the USA it rose from 8.1 to 9.4 per cent in the same period. All figures refer to seasonally-adjusted data from Eurostat .
Stable employment
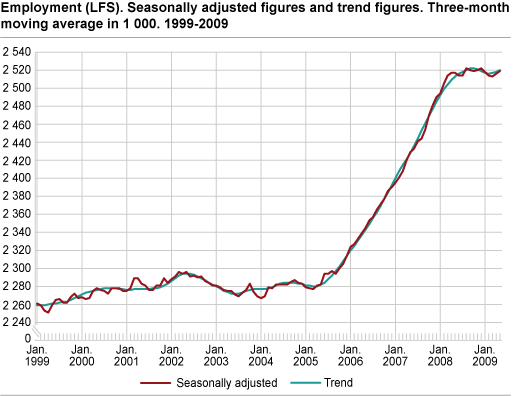
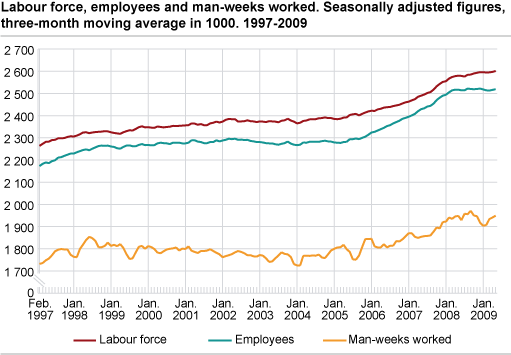
Employment increased by 5.000 from February (as measured by the average of the three months from January to March) to May (as measured by the average of the three months from April to June), but this is within the error margin in the LFS. When taking the error margin into account, employment has kept stable since May 2008. The increase in employment within public sector has contributed to reduce the effect of decrease in some industries within private sector.
Employment and unemployment figures include permanent residentsThe LFS only includes persons who are registered as residents in the population register. Persons working in Norway who are not registered as permanent residents or who are planning to stay for less than six months, are not included in the employment figure in the LFS. If these people lose their job, it does not count as a fall in employment or a rise in unemployment. In national accounts figures (NR), employed non-residents are included in the employment figure as long as they work in an establishment in Norway. If employment decreases in this group, it will count as a fall in employment in NR. Statistics Norway publishes separate figures for all registered non-residents once a year. See short-term immigrants . |
Uncertain figuresThe purpose of making seasonal adjustments is to describe the development over the last year, corrected for seasonal variations. In order to reduce uncertainty, the published series are three-month moving averages of the seasonally-adjusted figures. However, uncertainty means that sampling errors must be considered when interpreting the figures from the LFS. We normally compare the latest non-overlapping three-month periods. An overview of sampling errors in the LFS can be found in “ About the statistics ”, chapter 5 section 3. Quarterly LFS figures, not seasonally adjusted, are presented in a separate article . |
RevisionsThe complete time series is re-estimated each month, and this may cause some adjustments of previously published figures. See Revisions for more information . |
Tables:
The statistics is published with Labour force survey.
Contact
-
Arbeidsmarked og lønn
E-mail: arbeidsmarked@ssb.no
-
Erik Herstad Horgen
E-mail: erik.horgen@ssb.no
tel.: (+47) 93 08 68 62

