Content
Published:
This is an archived release.
Stable unemployment
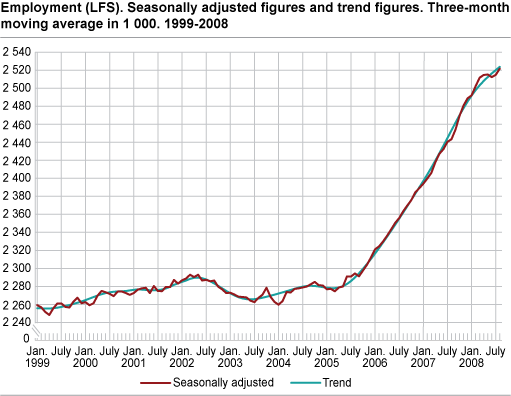
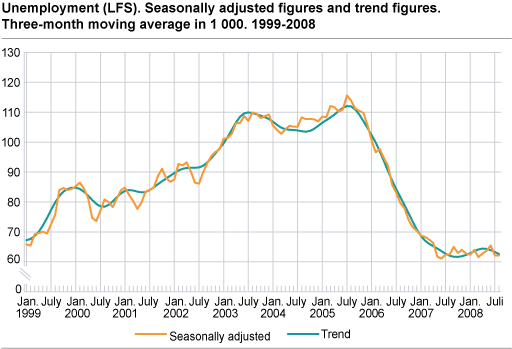
Unemployment has been stable since the summer of last year, and it was 2.4 per cent of the labour force in August 2008. The growth in employment has declined since the autumn of last year, and has now come to an end.
There has been growth in employment since the summer of 2005. The growth was at its highest in the autumn of last year, but has declined during 2008 and it has now ceased. Adjusted for seasonal variations, the Labour Force Survey (LFS) shows that the number of employed increased by 6 000 from May (as measured by the average of the three months from April to June) to August (as measured by the average of the three months from July to September). A change of 6 000 is inside the error margin. The figures for the age groups 16-24 and 25-74 show that growth has ceased specifically among young people. For figures by age, see the StatBank
Stable unemployment
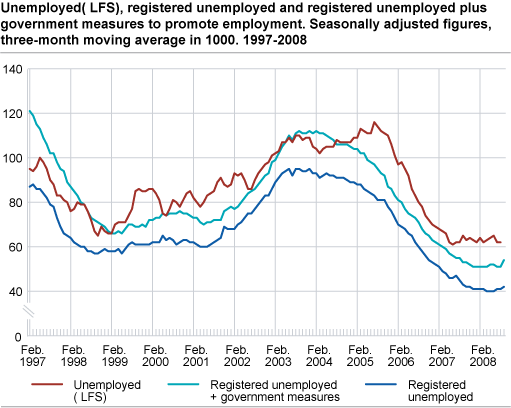
The unemployment rate stood at 2.4 per cent of the labour force in August (as measured by the average of the three months from July to September), while it was 2.5 per cent in May (as measured by the average of the three months from April to June). Since the summer of 2007, unemployment has moved between 2.4 and 2.6 per cent, and this is inside the error margin of the LFS. Seasonally adjusted figures for people registered unemployed and on government measures to promote employment with the Labour and Welfare Organisation (NAV) were unchanged from May to August. The latest figures from NAV show an increase of 3 000 people registered unemployed and on government measures to promote employment from August to September.
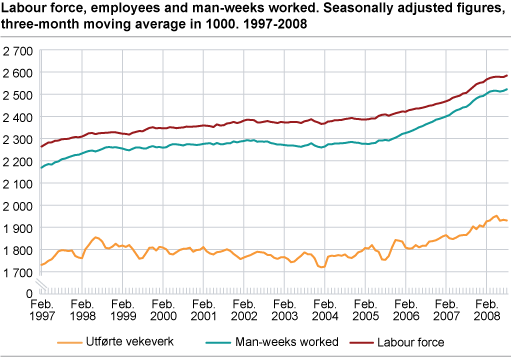
Man-weeks worked
From May (as measured by the average of the three months from April to June) to August (as measured by the average of the three months from July to September) the average number of man-weeks (37.5 hours) worked each week decreased by 21 000 adjusted for seasonal variations.
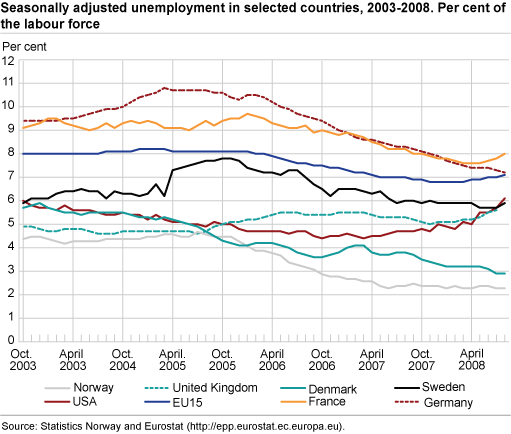
Unemployment up in the US
In the US unemployment was up from 5.5 to 6.1 per cent from May to August. The EU 15 had a smaller increase in unemployment over the same period. In France unemployment went up, while it went down in Germany. Among the Scandinavian countries, unemployment increased in Sweden, while it decreased in Denmark. All figures refer to seasonally adjusted data from Eurostat .
Employment and unemployment figures include permanent residentsThe LFS only includes persons who are registered as residents in the population register. Persons working in Norway, but who are not registered as permanent residents or who are planning to stay for less than six months, are not included in the number of employed in the LFS. Some of these will later become registered residents and then be included in the population covered by the LFS. Statistics Norway publishes separate figures for registered non-residents once a year. See short-term immigrants . |
Uncertain figuresThe purpose of making seasonal adjustments is to describe the development over the last year, corrected for seasonal variations. In order to reduce uncertainty, the published series are three-month moving averages of the seasonally adjusted figures. However, uncertainty means that sampling errors must be considered when interpreting the figures from the LFS. Usually we compare the latest non-overlapping three month periods. An overview of sampling errors in the LFS can be found in “ About the statistics” , section 5.3. Quarterly LFS figures, not seasonally adjusted, are presented in a separate article . |
Tables:
The statistics is published with Labour force survey.
Contact
-
Arbeidsmarked og lønn
E-mail: arbeidsmarked@ssb.no
-
Erik Herstad Horgen
E-mail: erik.horgen@ssb.no
tel.: (+47) 93 08 68 62