Content
Published:
This is an archived release.
Unemployment still falling
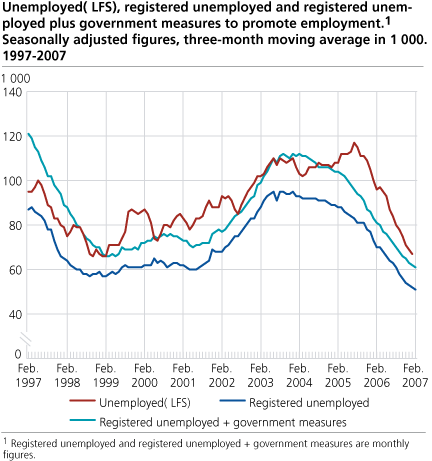
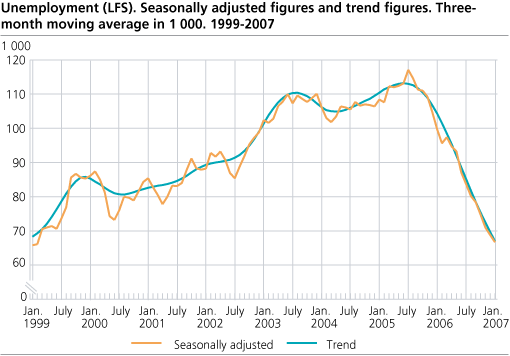
From October 2006 to January 2007, the number of unemployed people fell by 8 000 according to new, seasonally adjusted figures from Statistics Norway's Labour Force Survey. The unemployment rate stood at 2.7 per cent in January, down from 3.1 per cent in October.
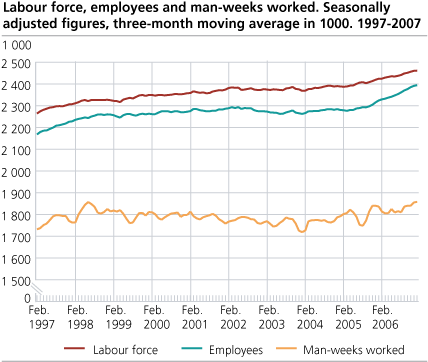
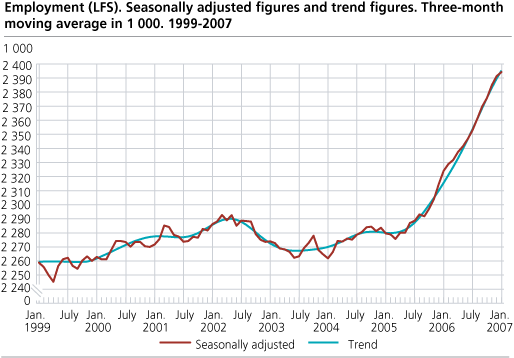
Adjusted for seasonal variations, the number of employed people increased by 18 000 from October (as measured by the average of the three months from September to November) to January (as measured by the average of the three months from December to February). The upward trend in employment that began in the summer of 2005, thereby continued into 2007. Adjusted for seasonal variations, the number of employed people increased by 107 000 from June 2005 to January 2007.
Unemployment rate at the same level as previous low
The number of unemployed people fell by 8 000 from October (as measured by the average of the three months from September to November) to January (as measured by the average of the three months from December to February). This brought the unemployment rate down to 2.7 per cent, from 3.1 per cent in October. The unemployment rate peaked at 4.9 per cent in mid-2005, and has fallen steadily since. It is now at the same level as the previous low in early 1999.
Seasonally adjusted figures of people registered unemployed with the Labour and Welfare Organisation, show a decline of 4 000 from October to January.
Continued growth in man-weeks worked
From October (as measured by the average of the three months from September to November) to January (as measured by the average of the three months from December to February), the average number of man-weeks (37.5 hours) worked each week rose by 19 000. This is consistent with the growth in these figures since the beginning of 2004.
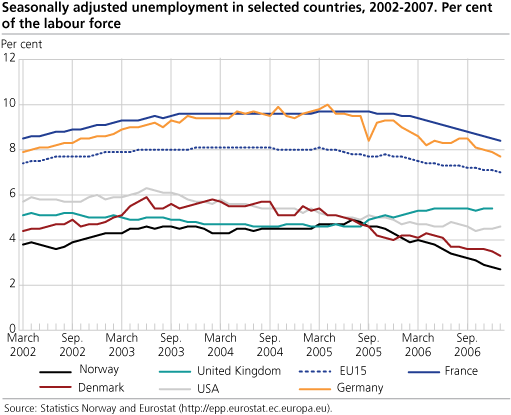
Unemployment rate down in many EU member states
From October 2006 to January 2007, the unemployment rate fell in 15 of the 27 member states. The unemployment rate for the EU15 fell from 7.2 to 7.0 per cent. Several large EU countries saw a decrease in unemployment during this period: In Germany, the unemployment rate fell from 8.1 to 7.7 per cent, and in France from 8.7 to 8.4 per cent. In the UK, the increase in unemployment appears to have levelled off. In Denmark, the unemployment rate fell from 3.6 to 3.3 per cent from October to January. The US saw an increase in unemployment during the same period, from 4.4 to 4.6 per cent. (All figures refer to seasonally adjusted data from Eurostat .)
|
Uncertain figures
The purpose of making adjustments for seasonal variations is to describe the development over the last year and provide estimates of change between the last two three-month periods, corrected for normal seasonal variations. In order to reduce uncertainty, the published series are three-month moving averages of the seasonally adjusted figures. For instance, the figures for January represent the average of the estimates for December, January and February. Quarterly LFS figures, not seasonally adjusted, are presented in a separate article . |
Tables:
The statistics is published with Labour force survey.
Contact
-
Arbeidsmarked og lønn
E-mail: arbeidsmarked@ssb.no
-
Erik Herstad Horgen
E-mail: erik.horgen@ssb.no
tel.: (+47) 93 08 68 62