Content
Published:
This is an archived release.
Continued growth in employment
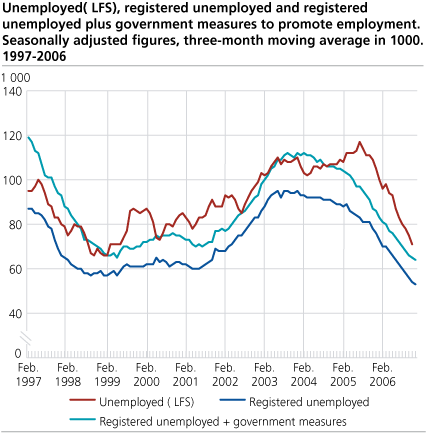
From August to November employment rose by 23 000 according to new, seasonally adjusted figures from Statistics Norway's Labour Force Survey. The number of unemployed people fell by 9 000 in the same period. The unemployment rate stood at 2.9 per cent in November, down from 3.3 per cent in August.
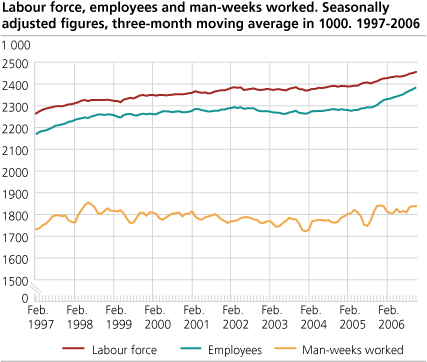
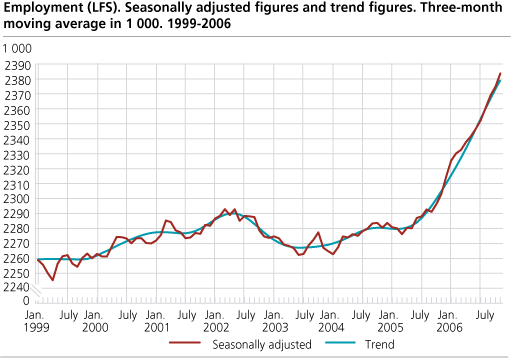
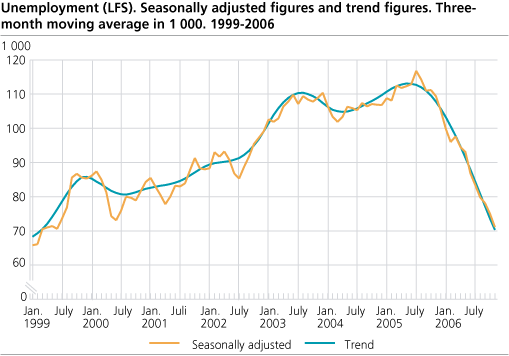
Adjusted for seasonal variations, the number of employed people increased by 23 000 from August (as measured by the average of the three months from July to September) to November (as measured by the average of the three months from October to December). The upward trend in employment which began in the summer of 2005, thereby continued to the end of 2006.
Unemployment rate below 3 per cent
The number of unemployed people fell by 9 000 from August (as measured by the average of the three months from July to September) to November (as measured by the average of the three months from October to December). This brought the unemployment rate down to 2.9 per cent, from 3.3 per cent in August. The unemployment rate started to fall in mid-2005 from a peak of 4.9 per cent. The previous low was 2.8 per cent in early 1999.
Seasonally adjusted figures of people registered unemployed with the Labour and Welfare Organisation, show a decline of 6 000 from August to November. The number of registered unemployed was lower in November 2006 than in early 1999, when the number of registered unemployed reached its previous low.
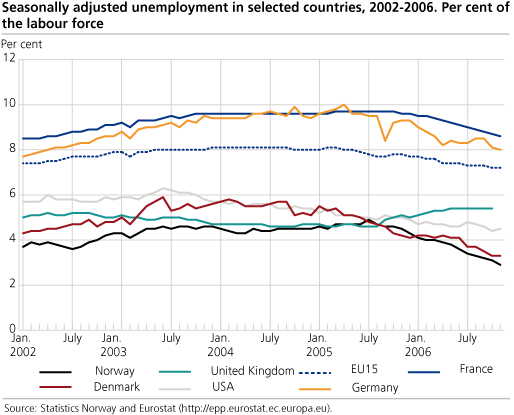
Unemployment rate continues to fall in Germany and France
The unemployment rate for the EU15 fell from 7.3 to 7.2 per cent from August to November. Several large EU countries saw a decrease in unemployment during this period: In Germany, the unemployment rate fell from 8.5 to 8.0 per cent, and in France from 8.9 to 8.6. In Germany, the unemployment rate is now two percentage points below its peak in spring 2005, when it reached 10.0 per cent. In Denmark, the unemployment rate fell from 3.7 to 3.3 per cent. The US also saw a decrease in unemployment, from 4.7 to 4.5 per cent. (All figures refer to seasonally adjusted data from Eurostat .)
Continued growth in man-weeks worked
From August (as measured by the average of the three months from July to September) to November (as measured by the average of the three months from October to December) 2006, the number of man-weeks worked rose by 29 000. This is consistent with the growth in these figures since the beginning of 2004.
|
Changes in the LFS from 2006
With effect from January 2006, some improvements have been made in the Norwegian LFS. This will make employment and unemployment figures more comparable with figures from the EU countries. In addition, actual working hours will be measured more accurately. Therefore, the changes have led to a level shift in the LFS figures. To maximise the comparability before/after 2006, the monthly figures for 2006 have been calculated according to the LFS prior to the changes. Quarterly LFS figures, i.e. not seasonally adjusted, are presented in a separate article . This article includes figures for the fourth quarter of 2006 according to the old and new version of the LFS, allowing data users to see the impact of the LFS changes on the various data series. For more details on the LFS, the seasonal adjustment method and the changes in the LFS, follow the links at the left side of this page. |
|
Uncertain figures
The purpose of making adjustments for seasonal variations is to describe the development over the last year and provide estimates of change between the last two three-month periods, corrected for normal seasonal variations. In order to reduce uncertainty, the published series are three-month moving averages of the seasonally adjusted figures. For instance, the figures for November represent the average of the estimates for October, November and December. |
Tables:
The statistics is published with Labour force survey.
Contact
-
Arbeidsmarked og lønn
E-mail: arbeidsmarked@ssb.no
-
Erik Herstad Horgen
E-mail: erik.horgen@ssb.no
tel.: (+47) 93 08 68 62