Content
Published:
This is an archived release.
Continued fall in unemployment
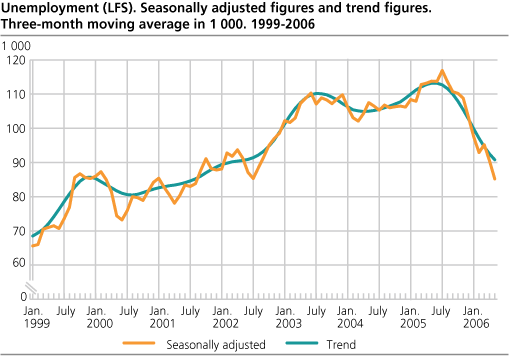
Unemployment fell by 8 000 people from February to May. The figures presented in this article are adjusted for seasonal variations.
The decline in unemployment from February (the January-March period) to May 2006 (April-June) is consistent with the development since the summer of 2005. Seasonally adjusted figures of registered unemployment at job centres show a decline of 3 000 people from February to May 2006.
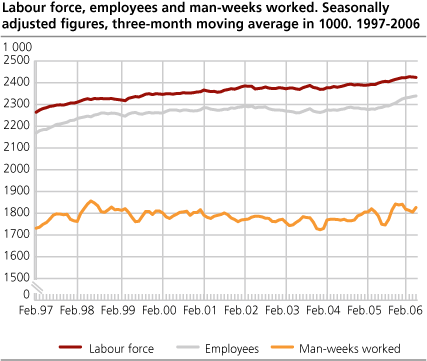
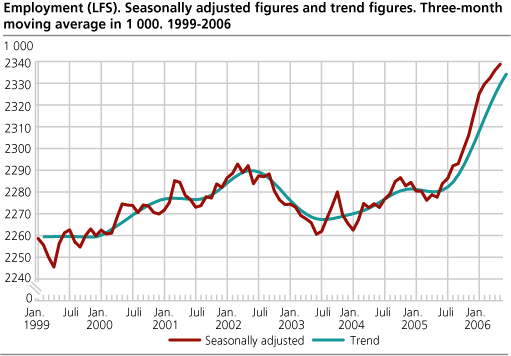
Employment increased by 9 000 people from February to May 2006, but this is inside the Labour Force Survey (LFS) error margin. Still, the last employment figure is consistent with the upward trend since the summer of 2005.
Unemployment also down internationally
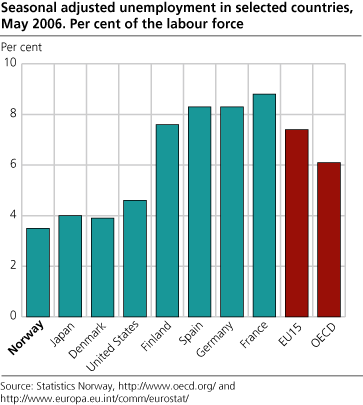
The seasonally adjusted unemployment rate for Norway was 3.5 per cent in May 2006, compared with 3.8 per cent in February. The rate in the EU15 area fell from 7.6 to 7.4 per cent, and in the OECD area from 6.3 to 6.1 per cent. In the same period, unemployment went down from 4.8 to 4.6 per cent in the USA. From February to May, unemployment fell from 4.3 to 3.9 per cent in Denmark, from 8.0 to 7.6 per cent in Finland, from 9.1 to 8.8 per cent in France, and from 8.9 to 8.3 per cent in Germany, according to figures from the OECD and Eurostat .
From February to May 2006, man-weeks worked rose by 8 000. This is inside the LFS error margin, but still consistent with the increase in these figures since the beginning of 2004.
Changes in the LFS from 2006
With effect from January 2006, some improvements have been made in the Norwegian LFS. This will make the employment and unemployment figures more comparable with figures from the EU-countries. In addition, actual working hours will be measured more accurately. Therefore, the changes have lead to a level shift in the LFS figures. To maximize the comparability before/after 2006, the figures for the months in 2006 have been calculated according to the LFS prior to the changes.
Quarterly LFS figures, i.e. not seasonally adjusted, are presented in a separate article . The belonging tables contain figures for the second quarter of 2006, both according the LFS before and after the change. This will give an insight in the effects of the LFS changes on the various figures. For more details on the LFS, the seasonal adjustment method and the changes in the LFS, you can click on the links at the left side of this page.
Uncertain figures
The purpose of making adjustments for seasonal variations is to describe the development over the last year and provide figures of change between the last two three-month periods, corrected for normal seasonal variations. In order to reduce uncertainty, the published series are three-month moving averages of the seasonally adjusted figures. For instance, the figures for May represent the average of the estimates for April, May and June.
Tables:
The statistics is published with Labour force survey.
Contact
-
Arbeidsmarked og lønn
E-mail: arbeidsmarked@ssb.no
-
Erik Herstad Horgen
E-mail: erik.horgen@ssb.no
tel.: (+47) 93 08 68 62


