Content
Published:
This is an archived release.
Flat unemployment from June to July
Unemployment remained unchanged at 4.5 per cent from June to July this year and was approximately on level with the July figure for last year. All figures are adjusted for seasonal variations.
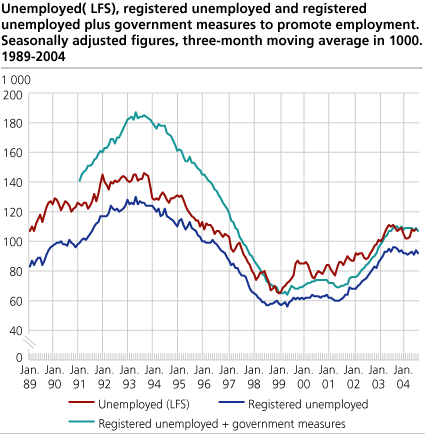
The latest figure for July (the June-August period) shows that unemployment remained unchanged from the previous month (the May-July period). Compared with July last year too, unemployment has only shown a minor decline. Seasonally adjusted figures of registered unemployment at job centres plus government measures to promote employment have remained more or less unchanged over the last year and approximately on level with the number of unemployed according to the Labour Force Survey (LFS).
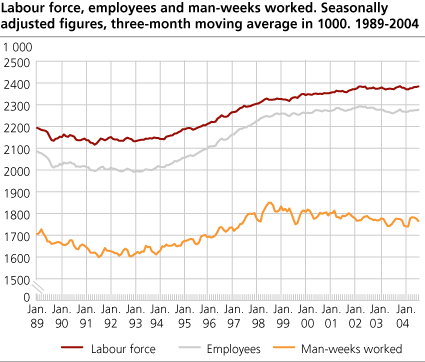
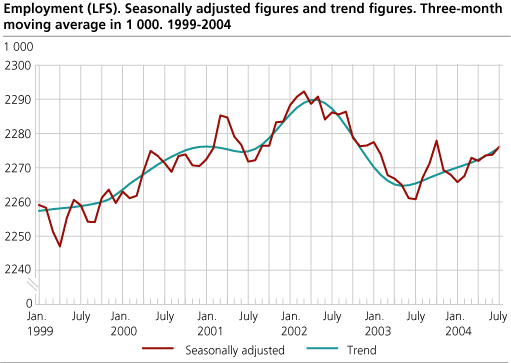
Following a long period of decline, employment started to increase in the summer of 2003. From June to July this year employment rose by 2 000. Although this is inside the LFS error margin, employment appears to be in an upward trend.
Stability internationally
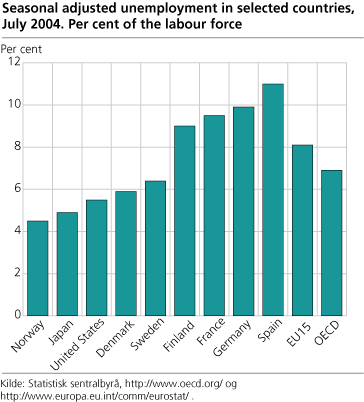
The seasonally adjusted unemployment rate for Norway was 4.5 per cent in July 2004, against 4.4 per cent in April. In the same period, unemployment in the EU and OECD area stayed unchanged at 8.1 and 6.9 per cent respectively. In the USA unemployment stood at 5.5 per cent in July, down 0.1 percentage points from April. Sweden saw unemployment grow from 6.3 to 6.4 per cent, while the figures for Denmark and Finland remained flat at 5.9 and 9.0 per cent. In France and Germany unemployment stayed approximately unchanged at 9.5 and 9.9 per cent respectively, according to figures from the OECD and Eurostat .
Man-weeks worked have shown a downward trend between June 1998 and May 2003. Since then, however, there have been signs of an increasing trend in these figures. From April to July this year man-weeks worked went down by 18 000, which is inside the LFS error margin.
Uncertain figures
Quality tests show that the seasonally adjusted LFS unemployment figures are uncertain. The seasonal-adjustment method has problems identifying a stable seasonal pattern for this series. The random component is relatively large compared with the seasonal component. The figures should therefore be treated with caution.
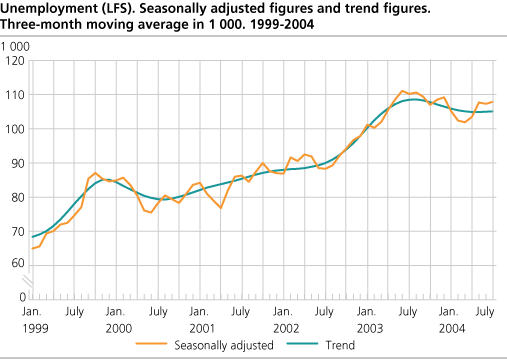
The purpose of adjusting for seasonal variations is to describe the development over the last year and provide figures of change between the last two three-month periods, corrected for normal seasonal variations. In order to reduce uncertainty, the published series are three-month moving averages of the seasonally adjusted figures. For instance, the figures for July represent the average of the estimates for June, July and August.
Tables:
The statistics is published with Labour force survey.
Contact
-
Arbeidsmarked og lønn
E-mail: arbeidsmarked@ssb.no
-
Erik Herstad Horgen
E-mail: erik.horgen@ssb.no
tel.: (+47) 93 08 68 62