Content
Published:
This is an archived release.
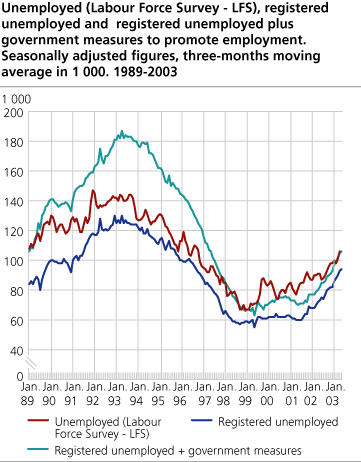
Unemployment up
The numbers of unemployed persons increased in the last 3-months period, while the numbers of employed persons decreased. The numbers are adjusted for seasonal variations.
Norwegian unemployment has increased weakly since the autumn 1999, according to seasonally adjusted figures from the LFS. From the 3-months period of December 2002 - February 2003 to March - May 2003 total unemployment increased by 7 000 persons. In per cent of the labour force the number of unemployed persons increased by 0.3 percentage points, which is outside the error margins. Seasonally adjusted figures of registered unemployed persons at the Employment Offices also increased the last 3-months period.
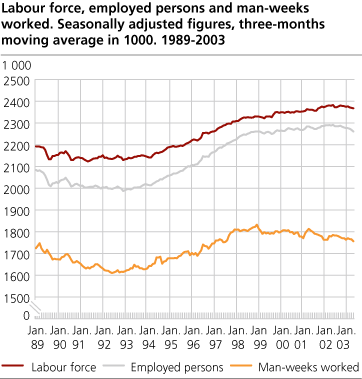
After a period of strong growth, the employment has shown a slight increase from 1999. In 2002 the number of employed persons started to decrease. From the 3-months period December 2002 - February 2003 to (March - May 2003), the number of employed persons decreased by 16 000.
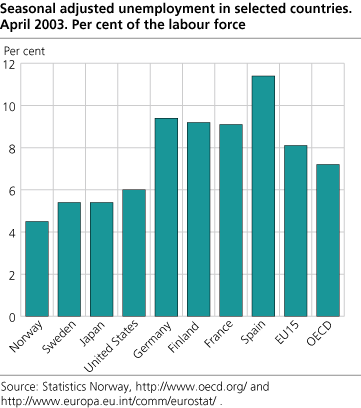
Unemployment increased in the EU
The seasonally adjusted unemployment rate in Norway increased from 4.2 per cent in January 2003 to 4.5 per cent in April 2003. In the same period the unemployment increased from 7.9 to 8.1 per cent as an average in the EU member countries. The unemployment rate in the OECD-countries as a whole increased from 7.0 to 7.2 per cent. In April 2003 the unemployment rate amounted to 6.0 in USA, 0.3 percentage point higher than in January 2003. The unemployment rate in Sweden was unchanged at 5.4 per cent, while in Finland it increased from 9.0 to 9.2 per cent. In the same period unemployment increased both in France and Germany. This is according to figures from Eurostat and OECD .
Man-weeks worked have shown a decreasing trend since the autumn 1999. The last 3 months period man-weeks worked decreased by 15 000.
About the man-weeks estimates
Previous to the seasonal adjustment, we make adjustments for holidays that fall in random months every year and other holidays. Due to the fact that the holidays May the 1st and Ascension Day fell on weekdays in May 2002, we adjust the figure of man-weeks worked up by 248 000 before seasonal adjustment. The adjustments are made so that the relative change in average weekly working hours from November 2002 to May 2003 is like last year's. In addition the holiday absence rates are set equal to the corresponding absence rates in the reference year 1991 in order to get comparable figures with the time series before the break in 1996. Before 1996 the Norwegian LFS surveys were not a continuous survey, but based on one week each month.
Uncertainty
Quality tests show that the seasonally adjusted LFS unemployment figures are uncertain. The seasonal-adjustment method has problems identifying a stable seasonal pattern for this series. The random component is relatively large compared with the seasonal component. The figures should therefore be used with caution.
The purpose of adjusting for seasonal variations is to describe the development during the last year and to give figures for change between the last two 3-month periods, cleared for normal seasonal variations. In order to reduce uncertainty, the presented series are three months moving averages of the seasonally adjusted figures. For instance the figure for April is the average of the estimates from March, April and May.
Tables:
The statistics is published with Labour force survey.
Contact
-
Arbeidsmarked og lønn
E-mail: arbeidsmarked@ssb.no
-
Erik Herstad Horgen
E-mail: erik.horgen@ssb.no
tel.: (+47) 93 08 68 62