Content
Published:
This is an archived release.
Unemployment up
The numbers of unemployed persons increased slightly from the 3-months period May - July 2002 to August - October 2002, while the numbers of employed persons were about unchanged. The numbers are adjusted for seasonal variations.
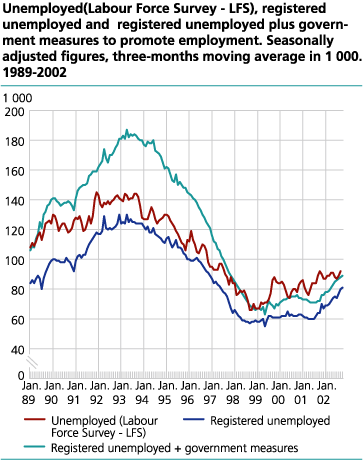
Norwegian unemployment has shown a weak increase since the autumn of 1999 according to seasonally adjusted figures from the LFS. From the 3-months period May - July 2002 to August - October total unemployment increased by 4 000 persons. In per cent of the labour force the number of unemployed persons increased by 0.2 percentage points, which is slightly within the error margins. Seasonally adjusted figures of registered unemployed persons at the Employment Offices the last year indicate an increasing unemployment.
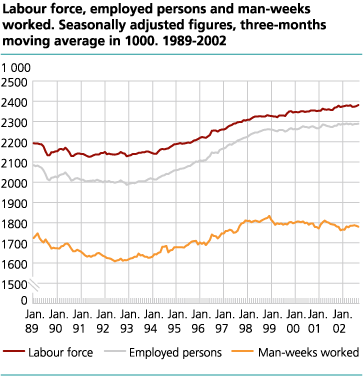
The employment has from 1999 and onwards shown only a slight increase, after a period of strong growths. Through 2002 the numbers of employed persons have been just about unchanged. From the 3-months period May - July 2002 to August - October the numbers of employed persons increased by 5 000, which is within the error margins.
Man-weeks worked
Man-weeks worked have shown a decreasing trend since autumn of 1999. It looks like the latest figures support the trend, however, the decrease in man-weeks worked of 5 000 from the 3-months period May - July this year to August - October is within the error margins.
The relationship between employed persons and man-weeks worked
In period's employment measured in number of persons and measured in man-weeks worked shows different patterns. The main two reasons for this are the following. First of all, average working hour per week goes down when a higher proportion are only working part time. The other factor is increased absence. The last couple of years the number of persons with temporary absence from work has increased. Increased holydays, sickness absence and leave of absence are important factors for this. Due to this man-weeks worked were decreased, while the number of employed persons will be unchanged, sees isolated. In practise, some of the decrease in man-weeks worked was setoff by substitutes, and therefore also increasing employment.
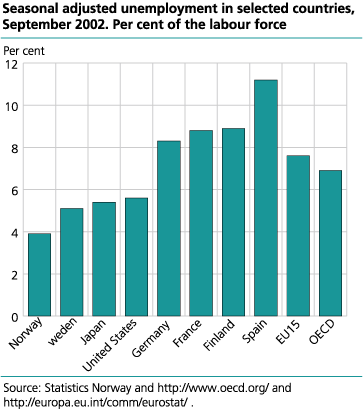
Unemployment in the EU and the OECD: 7.6 and 6.9 per cent
The seasonally adjusted unemployment rate in Norway increased from 3.7 per cent in June this year to 3.9 per cent in September. In the same period unemployment were unchanged at 7.6 per cent as an average in the EU member countries. The unemployment rate in the OECD-countries as a whole was unchanged at 6.9 per cent in the same period. In September 2002 the unemployment rate amounted to 5.6 in USA, 0.3 percentage point lower than in June. In the same period the unemployment rate increased from 4.9 to 5.1 per cent in Sweden, while in Finland the unemployment rate decreased from 9.3 to 8.9 per cent. This is according to figures from OECD .
Unemployment measures unequal
While LFS indicate an increasing unemployment-trend since autumn of 1999, the growths in registered unemployed persons at the Employment Offices came later, but then stronger.
Mainly due to fact that the different measures pick up changes in the unemployment differently and that LFS has sample uncertainty, the different measures gives unequal account of the unemployment.
Uncertainty
Quality tests show that the seasonally adjusted LFS unemployment figures are uncertain. The seasonal-adjustment method has problems identifying a stable seasonal pattern for this series. The random component is relatively large compared to the seasonal component. In addition there are only a few unemployed persons, which may result in the uncertainty being considerable. The figures should therefore be used with caution.
The purpose of adjusting for seasonal variations is to describe the development during the last year and to give figures for change between the last two 3-month periods, cleared for normal seasonal variations. In order to reduce uncertainty, the presented series are three months moving averages of the seasonally adjusted figures. For instance the figure from September is the average of the estimates from August, September and October.
Tables:
The statistics is published with Labour force survey.
Contact
-
Arbeidsmarked og lønn
E-mail: arbeidsmarked@ssb.no
-
Erik Herstad Horgen
E-mail: erik.horgen@ssb.no
tel.: (+47) 93 08 68 62