Content
Published:
This is an archived release.
Minor changes in employment and unemployment
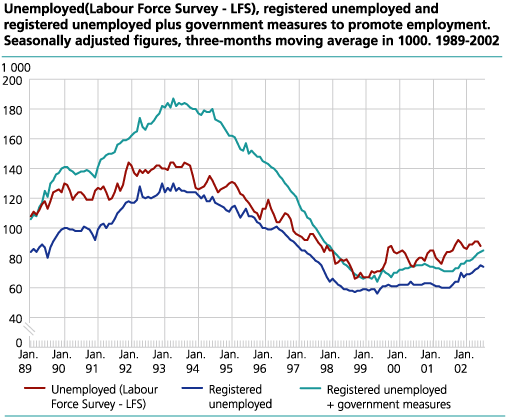
According to seasonally adjusted figures from the Labour Force Surveys (LFS) only small changes occurred in total employment and unemployment from the 3-month period February-April 2002 to May-July.
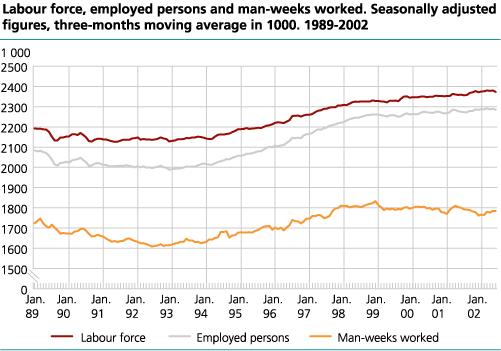
Norwegian employment and unemployment have shown a weak increase during the last two years. From the 3-month period February-April 2002 to May-July total employment and unemployment decreased by 6 000 and 1 000 respectively. Both changes are within the error margins.
A total of 2 303 000 persons were employed and 95 000 persons were unemployed in the 2n d quarter of 2002 according to figures from the Labour Force Survey (LFS), not seasonally adjusted.
Man-weeks worked
The number of man-weeks worked increased by 3 000 from the 3-month period February-April this year to May-July, which also is within the error margins.
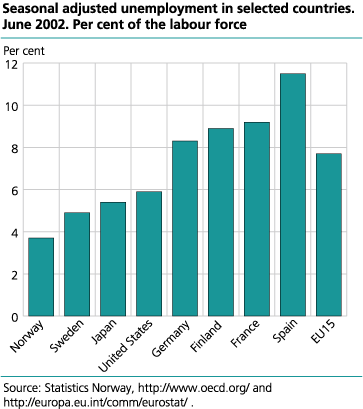
Unemployment in the EU is 7.7 per cent
While the seasonally adjusted unemployment rate in Norway remained unchanged at 3.7 per cent from March to June 2002, it increased from 7.6 to 7.7 per cent as an average in the EU member countries.
In June 2002 the unemployment rate amounted to 5.9 in USA, 0.2 percentage point higher than in March. In the same period the unemployment rate decreased from 5.1 to 4.9 per cent in Sweden. In Finland the unemployment rate fell from 9.1 to 8.9 per cent, according to figures from the Eurostat .
Prior to 1996 there was only one survey week each month in the Norwegian LFS. In July in the reference year 1991 the survey week was the third week of the month, where the proportion on holiday is high. The proportion of the population on holiday in July the years after 1995, when all weeks were surveyed, was a little lower compared with July 1991. Due to this July has had too few leave substitutes since 1996. The employment figures for July this year were therefore adjusted upwards by 24 000 before seasonal adjustment. July last year this adjustment upwards was 21 100 leave substitutes.
The purpose of adjusting for seasonal variations is to describe the development during the last year and to give figures for change between the last two 3-month periods, cleared for normal seasonal variations. In order to reduce uncertainty, the presented series are three months moving averages of the seasonally adjusted figures. For instance the figure from June is the average of the estimates from May, June and July.
Tables:
The statistics is published with Labour force survey.
Contact
-
Arbeidsmarked og lønn
E-mail: arbeidsmarked@ssb.no
-
Erik Herstad Horgen
E-mail: erik.horgen@ssb.no
tel.: (+47) 93 08 68 62