Content
Published:
This is an archived release.
Increased employment
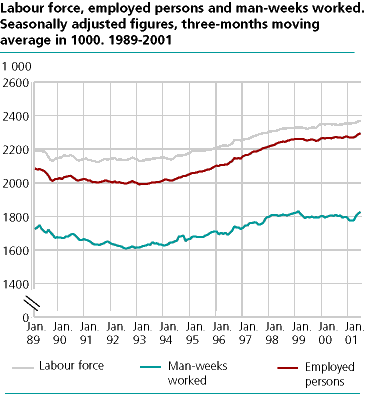
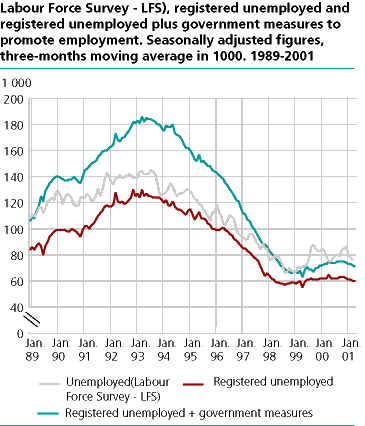
The number of employed persons rose by 24 000 from January to April 2001. In the same period the unemployment fell by 9 000 persons.
Seasonally adjusted figures indicate that the increase in man-weeks worked from January to April this year is larger than the increase in number of employed persons.
Two matters make the figures of change in man-weeks worked especially uncertain. First, the January (December - February) observation in man-weeks worked is irregular low. Second, we make adjustments for holidays that fall in random months every year. In May 2001 May the 1st, May the 17th and Ascension Day all fell on weekdays.
Due to this fact we adjust the figure of man-weeks worked up by 301 000 before seasonal adjustment. The adjustments are made so that the relative change in average weekly working hours from April to May this year is like last year's. The figure of man-weeks worked May last year were adjusted up by 246 000, but then there were no wedged in working days and Ascension Day was in June. In May 2001 3 separate working days were wedged in by a day off on both side. The tendency to take time off on wedged in working days is higher than normal.
The purpose of adjusting for seasonal variations is to describe the development during the last year and to give figure for change between the last two 3-months periods. In order to reduce uncertainty the presented series are three months moving averages of the seasonally adjusted figures. For instance the figure from April is the average of the estimates from March, April and May.
Please use unadjusted figures from the LFS in order to get appropriate quarterly figures.
Tables:
The statistics is published with Labour force survey.
Contact
-
Arbeidsmarked og lønn
E-mail: arbeidsmarked@ssb.no
-
Erik Herstad Horgen
E-mail: erik.horgen@ssb.no
tel.: (+47) 93 08 68 62


