Content
Published:
This is an archived release.
Decline in man-weeks worked
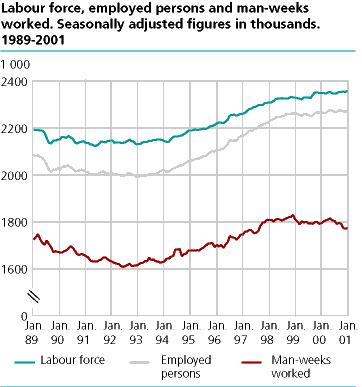
Man-weeks worked declined by 19 000 from October last year to January this year. Seen in longer perspective, man-weeks worked the last 3 months are at a lower level than in 1998 and 1999.
Minor changes in employment
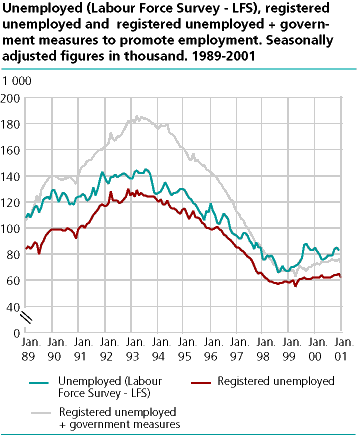
Adjusted for seasonal variations man-weeks worked declined by 19 000 from October 2000 to January 2001. There were only minor changes in the number of employed and unemployed persons.
Previous to the seasonal adjustment, we also make adjustments for holidays that fall in random months every year. This year part of the country had winter holiday during the week starting February 19., while last year most of the country had the winter holiday in March. Because of this the figure for man-weeks worked in February 2001 was based on interviews only from three weeks, from January29. - February 16., while the same figure for February 2000 also included an additional week. The figure for February this year is thus a little larger.
The purpose of adjusting for seasonal variations is to give figures for changes for the last three months and to describe the development during the last year. Please use unadjusted figures from the LFS in order to get appropriate quarterly figures.
Tables:
The statistics is published with Labour force survey.
Contact
-
Arbeidsmarked og lønn
E-mail: arbeidsmarked@ssb.no
-
Erik Herstad Horgen
E-mail: erik.horgen@ssb.no
tel.: (+47) 93 08 68 62


