Content
Published:
This is an archived release.
Higher participation rate among the oldest
New figures from the Labour Force Survey reveal that labour force participation increased among people aged 54 and over from 2002 to 2003. However, a decline in the participation rate among people under 55 resulted in a fall in overall labour force participation.
|
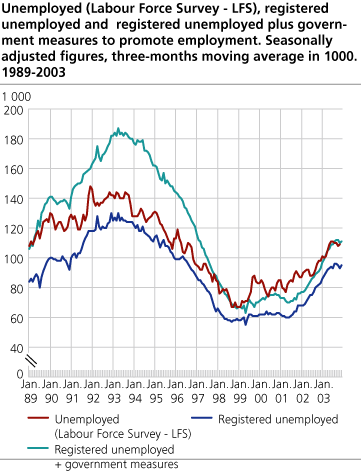
Seasonally adjusted figures: Small changes in the labour market
Employment and unemployment showed no real change from Q3 to Q4 2003, according to seasonally adjusted figures from the LFS. Both changes are inside the margin of errors derived from the sample uncertainty of the LFS.
|
Labour force participation for the age group 55-66 years increased from 64.6 to 65.2 per cent from 2002 to 2003. The corresponding figures for the age group 67-74 years were 8.6 and 9.1 per cent. As unemployment remained stable for the oldest age groups, the increase is directly attributable to growth in employment.
Total labour force participation for 16-74 year olds went down from 73.5 per cent in 2002 to 72.9 per cent in 2003. This is attributable to a decline in the participation rate for all age groups under 55, but the age groups 16-19 and 25-39 years are most strongly affected. With the labour market becoming less sluggish in the second half of 2003, the figures improved more for all groups from Q4 2002 to Q4 2003, when compared to the annual average figures.
Rise in unemployment
The number of unemployed people in Q4 2003 was 98 000, an increase of 11 000 from Q4 2002. The unemployed constituted 4.2 per cent of the working force, compared to 3.7 per cent one year earlier. Unemployment was highest among men - at 4.7 per cent compared to 3.6 per cent for women. The increase from the same quarter in 2002 mainly affected people aged 25-54, while unemployment remained flat for the youngest and oldest age groups. Most of the unemployment growth came among people looking for a long part-time job (20-36 hours per week).
The proportion of long-term unemployed has increased from 22 to 25 per cent over the past year. Long-term unemployment is defined as having been out of work for six consecutive months and being out of work at the time of interview. The average period of unemployment increased from 19.2 weeks in Q4 2002 to 20.9 weeks in Q4 2003.
Higher unemployment in Sweden
The seasonally adjusted unemployment rate for Norway was 4.6 per cent both in November and August 2003. EU unemployment remained flat at 8.0 per cent, while the unemployment rate in OECD countries fell from 7.1 to 7.0 per cent. The USA saw unemployment fall by 0.2 percentage points to 5.9 per cent from August to November, while Sweden experienced unemployment growth from 5.6 per cent to 6.0 per cent. Unemployment went down from 9.0 to 8.9 per cent in Finland, while it remained more or less unchanged in Germany and France. This is according to figures from OECD and Eurostat .
More under-employment
90 000 people were under-employed in Q4 2003, i.e. part-time employees seeking more work - an increase of 10 000 from the same quarter the year before. This represents 14.9 per cent of all part-time employees, compared to 13.3 per cent in Q4 2002. More than half of the under-employed are seeking full-time work.
The work hours of the unemployed and under-employed in Q4 2003 amounted to 115 000 man weeks (full-time work), an increase of 12 000 from the corresponding quarter in 2002.

Employment down in manufacturing
Employment remained stable from Q4 2002 to Q4 2003. However, employment in manufacturing and transport and communication fell by 10 000 and 9 000 respectively.
Unchanged temporary employment
192 000 people were in temporary employment in Q4 2003, approximately the same level as in the same quarter of 2002. This corresponds to 9.2 per cent of all employees, against 9.4 per cent in 2002. Temporary employment was most common in hotels and restaurants, health and social work, the primary industries, and education. In the opposite end we find financial intermediation and business activities, in addition to manufacturing.
Tables:
- Table 1. Population aged 16-74 in the labour force, man-weeks worked, registered unemployed persons and persons employed by government measures. 1000 and per cent
- Table 2. Population aged 16-74 år in the labour force, employed persons and unemployed persons by sex (LFS). 1000 and per cent
- Table 3. Persons in the labour force and employed persons by age and sex (LFS). 1 000 and per cent
- Table 4. Population aged 16-74, employed persons by settled/usual working hours per week(1) and unemployed persons by age and sex (LFS). 1000
- Table 5. Persons in the labour force by age and sex. 1000 and as per cent of all in each group
- Table 6. Employed persons by sex and settled/usual working hours pr week (LFS). 1 000
- Table 7. Population aged 16-74 by main activity, part-time employment1 and age (LFS). 1 000
- Table 8. Employed persons by major industry division. 1000
- Table 9. Number of man-hours worked per week1, by industry division (LFS). 1 000
- Table 10. Employed persons,total, and employed persons at work by status and sex. Number of man-hours worked1 and actual working hours per week (LFS)
- Table 11. Employed persons and absence from work during the whole survey week by reason for absence and sex(1). 1000 and per cent
- Table 12. Employees with temporary jobs, by major industry division (LFS). 1000 and as per cent of all employees
- Table 13. Unemployed persons by sex and age (LFS). 1000 and per cent
- Table 14. Unemployed persons by duration of job search (LFS). 1000 and per cent
- Table 15. Unemployed persons by main activity (LFS). 1 000
- Table 16. Unemployed and underemployed persons, by sex and desired working hours per week. Number of man-weeks (of 37,5 hours) supplied (LFS). 1000
- Table 17. Employment and unemployment for persons aged 16-74 years, seasonally adjusted, three-months moving average. Absolute figures in 1000 and unemployed persons in per cent of the labour force.
- Table 18. Persons in the labour force by sex and region (LFS). 1 000 and in per cent of total
- Table 19. Employed persons by sex and region (LFS). 1 000
- Table 20. Employed persons by sex and regions (LFS) as per cent of all inn each group.
- Table 21 Employed persons, by some major industry division and region (LFS). 1997-2003. 1 000
Contact
-
Arbeidsmarked og lønn
E-mail: arbeidsmarked@ssb.no
-
Erik Herstad Horgen
E-mail: erik.horgen@ssb.no
tel.: (+47) 93 08 68 62
-
Håvard Hungnes Lien
E-mail: havard.lien@ssb.no
tel.: (+47) 40 90 26 06