Content
Published:
This is an archived release.
Weakened trade balance in August
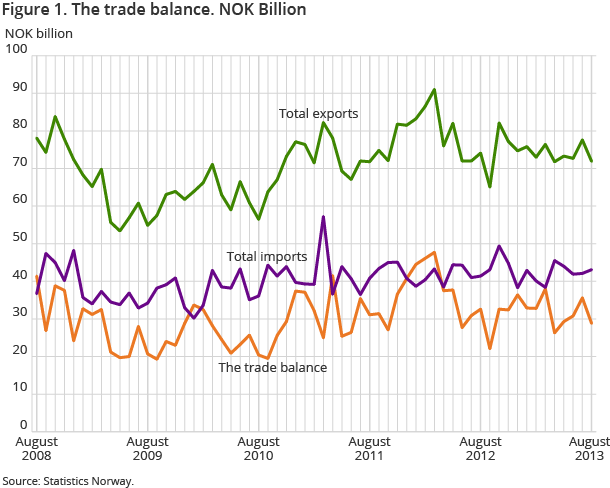
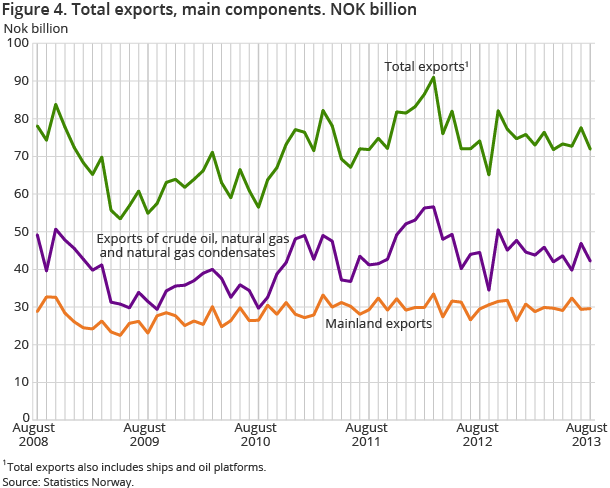
The exports of goods in August 2013 amounted to NOK 71.9 billion, while imports ended at NOK 43.1 billion. There was a drop in oil and gas exports and an increased import. This caused a lower trade surplus, down 11.7 per cent compared to August 2012.
| NOK Million | Change in per cent | NOK Million - so far this year | Change in per cent - so far this year | ||
|---|---|---|---|---|---|
| August 2013 | July 2013 - August 2013 | August 2012 - August 2013 | August 2013 | August 2012 - August 2013 | |
| 1Due to the data collection method, the preliminary monthly figures published for ships and oil platforms are often incomplete. In retrospect, therefore, the trade in these goods could in some cases lead to major corrections in the figures. Please see tables 2-4 for the impact these figures have on the external trade. | |||||
| Imports | 43 123 | 2.5 | 4.1 | 338 043 | 1.8 |
| Ships and oil platforms1 | 1 082 | 286.4 | 478.6 | 5 798 | 15.8 |
| Exports | 71 924 | -7.3 | -2.9 | 592 490 | -6.9 |
| Crude oil | 25 752 | -5.7 | -5.0 | 186 992 | -12.9 |
| Natural gas | 15 865 | -15.5 | -4.4 | 156 188 | -7.7 |
| Natural gas condensates | 563 | -29.5 | -26.3 | 5 603 | -30.9 |
| Ships and oil platforms1 | 119 | -90.9 | 29.3 | 4 081 | -15.5 |
| Mainland exports | 29 624 | 0.7 | 0.5 | 239 625 | -0.1 |
| The trade balance | 28 801 | -19.0 | -11.7 | 254 447 | -16.5 |
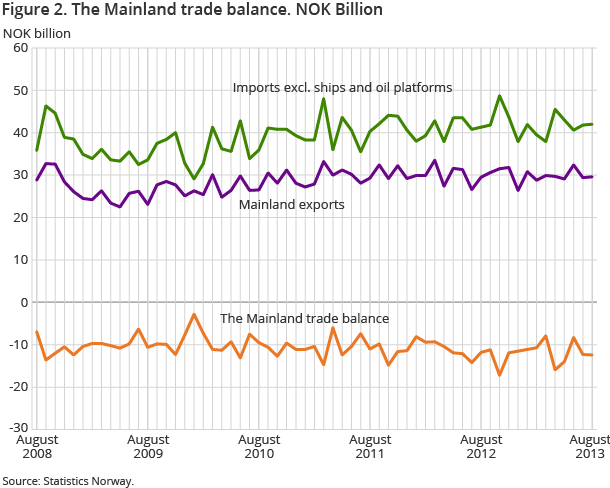
| The mainland trade balance | -12 417 | -0.6 | -5.4 | -92 620 | 6.1 |
The fall in exports in August 2013 was 2.9 per cent compared to August 2012. While the export of oil and gas was down, the other important export products fish and metals pulled in the opposite direction. The trade balance was additionally weakened by higher imports. Imports increased by 4.1 per cent from August last year partly due to the purchase of ships and oil.
Exports of oil and natural gas down
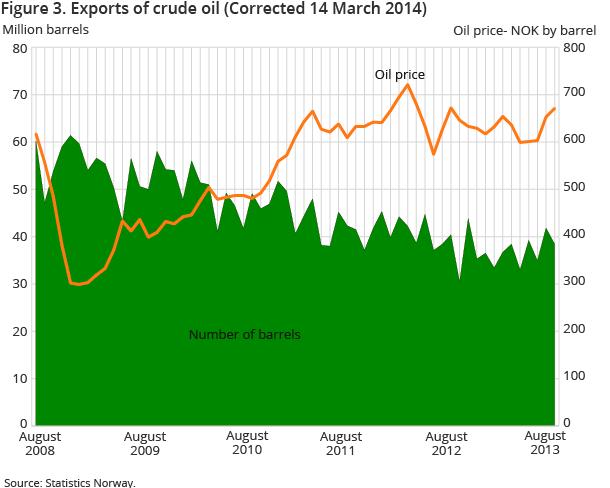
The value of crude oil exports amounted to NOK 25.8 billion in August; a 5 per cent decrease compared to last year. A total of 38.4 million barrels of oil were exported; 2.0 million barrels more than August 2012. The price per barrel of crude oil was unchanged at NOK 671.
Exports of natural gas also decreased, by 4.4 per cent, to a total of NOK 15.9 billion in August 2013. A total of 6.9 billion standard cubic metres of natural gas were exported in the same month, compared to 7.6 billion the year before.
Higher exports of fish but metals down
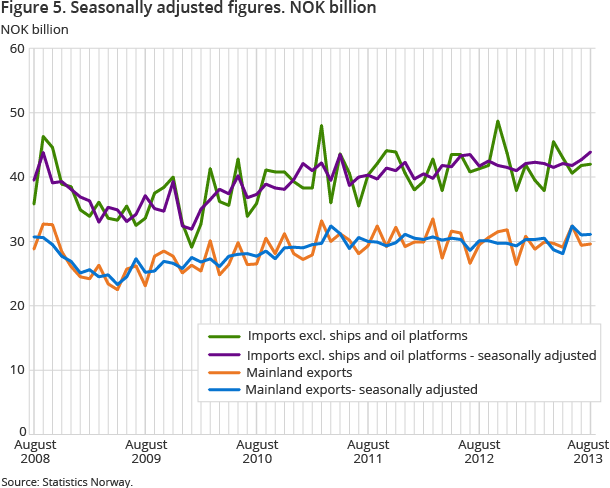
The total export of mainland goods ended at NOK 29.6 billion in August, up just NOK 146 million from August 2013.
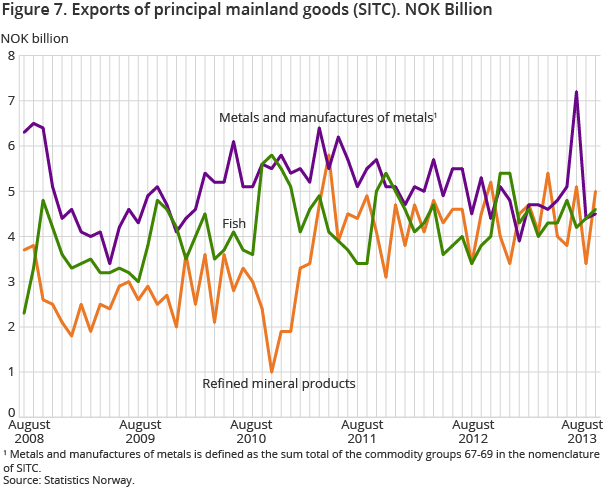
The export value of fish exports ended at NOK 4.6 billion, an increase of NOK 747 million, or 19.5 per cent. Exports of fresh whole salmon increased by almost NOK 665 million due to a rise in salmon prices from last August, which were up more than NOK 13 per kilogramme. The volume of this export was down almost 6.1 thousand tonnes. Norwegian metal exports, however, fell by a total of NOK 847 million. Iron and steel was down NOK 356 million and non-ferrous metals fell NOK 91 million. Lower quantities and prices were the reasons behind these falls.
The export of machinery normally varies considerably. In this group the export of machinery for special industries was down by 16.3 per cent, general industrial machinery by 15.0 per cent and electrical machinery by 22.7 per cent. The export value of these totalled around NOK 3.3 billion this month compared to NOK 4.0 billion in August 2013. However, exports of refined mineral products were up NOK 507.3 million.
Ships and oil push imports up
The imports in August 2013 amounted to NOK 43.1 million. This was up NOK 1.7 billion or 4.1 per cent from last August.
An important reason behind this rise was a NOK 750 million increase in imports in the commodity group of mineral oil and mineral products. Furthermore, the import of other transport equipment was up NOK 660 million due to imports of ships.
Among the other commodities, there was a mix of higher and lower imports compared to August 2012. The import of crude materials increased by NOK 121 – where metalliferous ores was up NOK 190. The import of chemicals was down NOK 430 million.
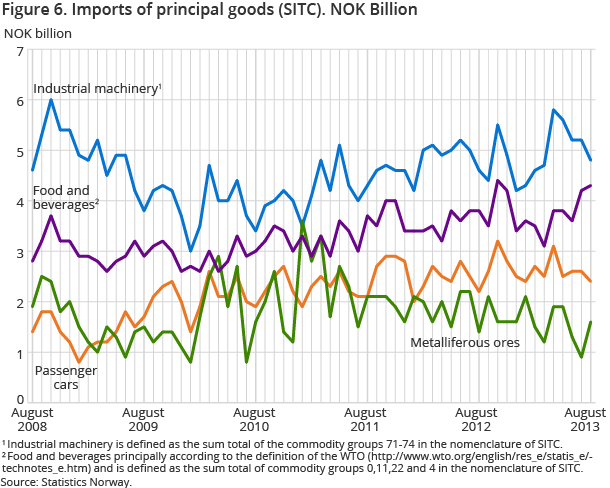
The import value of industrial machinery in total was NOK 4.8 billion in August 2013, a moderate rise of NOK 147 million compared to the same month last year. The groups office machines, automatic data processing equipment and telecommunications equipment were down by a total of NOK 375 million. There was a drop in the imports of laptops and tablet computers.
Passenger car imports increased by NOK 175.7 million compared to 2012.
Contact
-
Information services external trade
E-mail: utenrikshandel@ssb.no
-
Nina Rolsdorph
E-mail: nina.rolsdorph@ssb.no
tel.: (+47) 41 51 63 78
-
Jan Olav Rørhus
E-mail: jan.rorhus@ssb.no
tel.: (+47) 40 33 92 37

