Content
Published:
This is an archived release.
Financial crisis affecting Norway’s trade
Exports of goods came to NOK 65 billion in December 2008, while imports totalled NOK 38 billion. The continued drop in oil revenue caused a further decline in the export figures. The financial crisis has also led to a fall in the import of cars and the export of non-ferrous metals.
Reference is also made to the article Record high external trade in 2008 describing the calendar year 2008. |
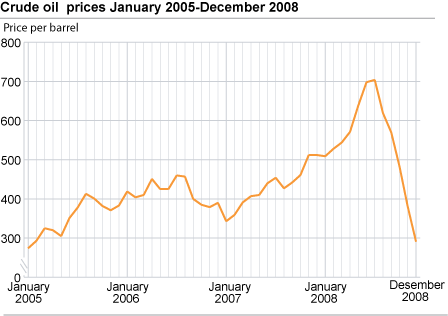
In December, the export value of crude oil was NOK 17.9 billion; down 45 per cent from last December and the lowest in four years. However, the number of barrels exported was the highest this year. The average crude oil price was NOK 291 per barrel in December 2008 and NOK 512 in December last year, almost a halving of the price. Furthermore, this is the lowest oil price in four years.
Exports of natural gas increased by 35 per cent from December 2007, reaching NOK 20.1 billion. This is the highest export value ever registered. Due to both higher prices and volume, the total income from natural gas exports was high in 2008.
| January-December | Change in per cent | December | Change in per cent | ||||||||||||||||||||||||||||||||||||
|---|---|---|---|---|---|---|---|---|---|---|---|---|---|---|---|---|---|---|---|---|---|---|---|---|---|---|---|---|---|---|---|---|---|---|---|---|---|---|---|
| 2007 | 2008 | 2007 | 2008 | ||||||||||||||||||||||||||||||||||||
| 1 Imports | 460 234 | 484 124 | 5.2 | 36 053 | 37 990 | 5.4 | |||||||||||||||||||||||||||||||||
| 2 Exports | 786 357 | 918 412 | 16.8 | 75 654 | 64 870 | -14.3 | |||||||||||||||||||||||||||||||||
| Of which | |||||||||||||||||||||||||||||||||||||||
| Crude oil | 309 675 | 355 571 | 14.8 | 32 339 | 17 895 | -44.7 | |||||||||||||||||||||||||||||||||
| Natural gas | 134 506 | 192 761 | 43.3 | 14 853 | 20 101 | 35.3 | |||||||||||||||||||||||||||||||||
| Condensates | 7 305 | 10 312 | 41.2 | 380 | 615 | 61.6 | |||||||||||||||||||||||||||||||||
| 3 Exports excl. crude oil, natural gas and condensates | 334 871 | 359 768 | 7.4 | 28 081 | 26 259 | -6.5 | |||||||||||||||||||||||||||||||||
| 4 Trade balance (2-1) | 326 123 | 434 288 | 33.2 | 39 601 | 26 880 | -32.1 | |||||||||||||||||||||||||||||||||
| 5 Trade balance excl. oil, natural gas and condensates (3-1) | -125 363 | -124 357 | . | -7 971 | -11 731 | . | |||||||||||||||||||||||||||||||||
The export value of goods excluding ships, oil platforms, crude oil, condensates and natural gas reached NOK 26.3 billion in December; down NOK 1.8 billion from 2007. The export of
refined mineral products decreased by NOK 1.6 billion and electrical machinery by NOK 670 billion.
Non-ferrous metals fell by NOK 926 million from December 2007, however on a yearly basis, exports have fallen dramatically; by more than NOK 13 billion. This is due to a reduction in exports of nickel by NOK 8.9 billion. Prices have fallen since 2007, when prices were especially high. Exports of aluminium also fell (by NOK 1.9 billion), which was due to reduced quantity and price. This is particularly prevalent in the last months of 2008.
Imports of goods excluding ships and oil platforms totalled NOK 38 billion in December, compared with NOK 36 billion in the corresponding month of the previous year. The commodities with the highest growth were chemicals, which increased by NOK 722 million, general industrial machinery with NOK 720 million, and miscellaneous manufactured articles by NOK 610 billion. By contrast, imports of road vehicles have fallen by NOK 3.5 billion since 2007, a year with very high imports. The import of cars was particularly low in the last months of 2008, and was the lowest since January 2000.
Tables:
- Table 1 Imports of commodities, ships and oil platforms excluded. December and January-December 2007 and 2008. NOK million
- Table 2 Exports of commodities, ships and oil platforms excluded. December and January-December 2007 and 2008. NOK million
- Table 3 Trade with countries and regional groups of countries. January-December 2007 and 2008. NOK million
Contact
-
Information services external trade
E-mail: utenrikshandel@ssb.no
-
Nina Rolsdorph
E-mail: nina.rolsdorph@ssb.no
tel.: (+47) 41 51 63 78
-
Jan Olav Rørhus
E-mail: jan.rorhus@ssb.no
tel.: (+47) 40 33 92 37

