Content
Published:
This is an archived release.
Increase in household consumption
Seasonally-adjusted figures show that household consumption of goods was 1.1 per cent higher in May than in April. Consumption of electricity pulled the index slightly down, whereas purchases of leisure equipment pulled it up.
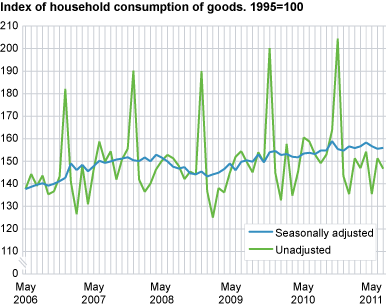
The households’ consumption of ‘other goods’ increased the most from April to May. Here the growth was 1.8 per cent according to seasonally-adjusted figures. It was purchases of books, leisure equipment, clothes and shoes that contributed most towards the increase in this group of goods.
Consumption of food, beverages and tobacco as well as purchases of vehicles and petrol also showed increases from April to May of 0.5 and 1.0 per cent respectively.
Consumption of electricity and heating fuels on the other hand decreased by 0.9 per cent.
Without adjustments for seasonal variations, the household consumption of goods was 6.2 per cent higher in May 2011 compared with May 2010.
| Period | Sesonally adjusted |
Change from previous month.
Per cent |
Unadjusted |
Change from the same month last year.
Per cent |
|||||||||||||||||||||||||||||||||||||||||||||||||||||||||||||||||||||||||||
|---|---|---|---|---|---|---|---|---|---|---|---|---|---|---|---|---|---|---|---|---|---|---|---|---|---|---|---|---|---|---|---|---|---|---|---|---|---|---|---|---|---|---|---|---|---|---|---|---|---|---|---|---|---|---|---|---|---|---|---|---|---|---|---|---|---|---|---|---|---|---|---|---|---|---|---|---|---|---|---|
| 2010 | |||||||||||||||||||||||||||||||||||||||||||||||||||||||||||||||||||||||||||||||
| May | 151.7 | -0.2 | 145.3 | 0.2 | |||||||||||||||||||||||||||||||||||||||||||||||||||||||||||||||||||||||||||
| June | 153.5 | 1.1 | 160.6 | 5.7 | |||||||||||||||||||||||||||||||||||||||||||||||||||||||||||||||||||||||||||
| July | 153.8 | 0.2 | 158.8 | 2.8 | |||||||||||||||||||||||||||||||||||||||||||||||||||||||||||||||||||||||||||
| August | 153.2 | -0.4 | 153.0 | 2.3 | |||||||||||||||||||||||||||||||||||||||||||||||||||||||||||||||||||||||||||
| September | 154.8 | 1.0 | 149.2 | 2.8 | |||||||||||||||||||||||||||||||||||||||||||||||||||||||||||||||||||||||||||
| October | 154.8 | 0.0 | 153.0 | -0.7 | |||||||||||||||||||||||||||||||||||||||||||||||||||||||||||||||||||||||||||
| November | 159.0 | 2.7 | 163.6 | 9.5 | |||||||||||||||||||||||||||||||||||||||||||||||||||||||||||||||||||||||||||
| December | 155.4 | -2.2 | 204.4 | 2.1 | |||||||||||||||||||||||||||||||||||||||||||||||||||||||||||||||||||||||||||
| 2011 | |||||||||||||||||||||||||||||||||||||||||||||||||||||||||||||||||||||||||||||||
| January | 154.7 | -0.5 | 143.4 | -1.0 | |||||||||||||||||||||||||||||||||||||||||||||||||||||||||||||||||||||||||||
| February | 156.6 | 1.2 | 135.4 | 2.1 | |||||||||||||||||||||||||||||||||||||||||||||||||||||||||||||||||||||||||||
| March | 155.9 | -0.5 | 151.4 | -4.0 | |||||||||||||||||||||||||||||||||||||||||||||||||||||||||||||||||||||||||||
| April | 156.6 | 0.5 | 147.0 | 9.0 | |||||||||||||||||||||||||||||||||||||||||||||||||||||||||||||||||||||||||||
| May | 158.3 | 1.1 | 154.3 | 6.2 | |||||||||||||||||||||||||||||||||||||||||||||||||||||||||||||||||||||||||||
| 1 | Please note that the indices have been revised. |
Method differs from the index of retail salesThe index of household consumption of goods describes the development in household consumption, while the index of retail sales measures the development in retail sales. Compared to the index of retail sales, the index of household consumption of goods has a wider selection of goods. The calculation of the index of household consumption of goods is based on information from the index of retail sales, plus purchases of cars (initial registration) and consumption of electricity and heating fuels. This may result in deviations in the development of the two indices. Additionally, it should be borne in mind that the “Standard Industrial Classification” changed on 1 January 2009, which inter alia means that petrol stations from then onwards are part of retail sales. |
Connection to quarterly national accountsThe index of household consumption of goods uses the same definitions and methods of compilation as the quarterly national accounts, and thus serves as an indicator of household consumption in the quarterly national accounts. |
RevisionsSince Statistics Norway gives a high priority to timeliness in the release of statistics, the index of household consumption of goods sometimes has to rely on preliminary estimates, which are replaced in subsequent releases. |
|
Seasonally - adjusted figures As regards the seasonally-adjusted figures, the figures for previous periods may be revised when a new month is added to the series. For further information, see About seasonal adjustments in the left column. |
Contact
-
Vemund Rundberget
E-mail: uve@ssb.no
tel.: (+47) 97 65 50 90