Content
Published:
This is an archived release.
Decrease for petrol stations
Compared to November 2007, turnover of petrol stations in Norway decreased by NOK 172.7 million, or 4.9 per cent. The total turnover was NOK 3.3 billion in November this year.
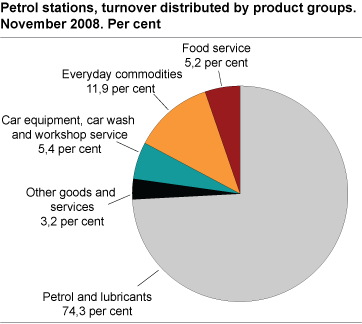
The turnover of engine fuel and lubricant made NOK 2.5 billion, NOK 152 million less than November 2007. This is equivalent to a decrease of 5.8 per cent. In the same period, everyday commodities and food service decreased by 1.8 and 4.4 respectively.
In the first eleven months of 2008, the total turnover of petrol stations in Norway was NOK 42.5 billion, an increase of NOK 3.5 billion compared with the corresponding period in 2007. This is equivalent to a rise of 8.9 per cent.
| Turnover | Change in per cent | ||||||||||||||||||||||||||||||||||||||
|---|---|---|---|---|---|---|---|---|---|---|---|---|---|---|---|---|---|---|---|---|---|---|---|---|---|---|---|---|---|---|---|---|---|---|---|---|---|---|---|
| November 2008 | January-November 2008 |
November 2007-
November 2008 |
January-November 2007-
January-November 2008 |
||||||||||||||||||||||||||||||||||||
| Total | 3 324 360 | 42 481 708 | -4.9 | 8.9 | |||||||||||||||||||||||||||||||||||
| Petrol and lubricants | 2 470 764 | 32 273 080 | -5.8 | 12.3 | |||||||||||||||||||||||||||||||||||
| Car equipment | 92 601 | 760 494 | -5.0 | -8.0 | |||||||||||||||||||||||||||||||||||
| Everyday commodities | 394 938 | 5 149 521 | -1.8 | -0.1 | |||||||||||||||||||||||||||||||||||
| Other goods including music and video sales | 79 771 | 1 028 839 | -9.1 | -7.2 | |||||||||||||||||||||||||||||||||||
| Food service | 172 836 | 2 148 044 | -4.4 | 2.2 | |||||||||||||||||||||||||||||||||||
| Workshop service and car wash | 85 425 | 806 878 | 6.9 | 3.1 | |||||||||||||||||||||||||||||||||||
| Renting | 8 420 | 115 407 | -13.5 | -9.8 | |||||||||||||||||||||||||||||||||||
| Games/commision | 19 605 | 199 162 | 20.0 | 24.1 | |||||||||||||||||||||||||||||||||||
Tables:
The statistics is published with Index of wholesale and retail sales.
Contact
-
Statistics Norway's Information Centre
E-mail: informasjon@ssb.no
tel.: (+47) 21 09 46 42