Content
Published:
This is an archived release.
Less turnover for petrol stations
The value of petrol sales on petrol stations increased, while we used less money on other goods in October this year.
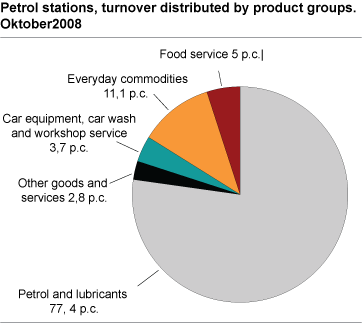
The turnover of engine fuel increased by 11.6 per cent from October 2007 to October 2008, mainly due to higher prices. All other product groups had a decrease in the same period. The total turnover was NOK 3.8 billion in October this year.
NOK 39.2 billion during the first ten months
Total turnover in petrol stations was NOK 39.2 billion in the first ten months of this year, up NOK 3.7 billion from the same period last year, and equivalent to a growth of 10.3 per cent.
| Turnover | Change in per cent | ||||||||||||||||||||||||||||||||||||||
|---|---|---|---|---|---|---|---|---|---|---|---|---|---|---|---|---|---|---|---|---|---|---|---|---|---|---|---|---|---|---|---|---|---|---|---|---|---|---|---|
| October 2008 | January-October 2008 |
October 2007-
October 2008 |
January-October 2007-
January-October 2008 |
||||||||||||||||||||||||||||||||||||
| Total | 3 804 323 | 39 157 065 | 7.1 | 10.3 | |||||||||||||||||||||||||||||||||||
| Petrol and lubricants | 2 945 951 | 29 802 316 | 11.6 | 14.2 | |||||||||||||||||||||||||||||||||||
| Car equipment | 80 333 | 667 893 | -10.8 | -8.4 | |||||||||||||||||||||||||||||||||||
| Everyday commodities | 421 782 | 4 754 583 | -4.1 | 0.0 | |||||||||||||||||||||||||||||||||||
| Other goods including music and video sales | 78 706 | 949 068 | -10.2 | -7.1 | |||||||||||||||||||||||||||||||||||
| Food service | 188 318 | 1 975 208 | -2.3 | 2.8 | |||||||||||||||||||||||||||||||||||
| Workshop service and car wash | 61 565 | 721 453 | -16.3 | 2.7 | |||||||||||||||||||||||||||||||||||
| Renting | 10 022 | 106 987 | -11.7 | -9.5 | |||||||||||||||||||||||||||||||||||
| Games/commision | 17 646 | 179 557 | -4.6 | 24.6 | |||||||||||||||||||||||||||||||||||
Tables:
The statistics is published with Index of wholesale and retail sales.
Contact
-
Statistics Norway's Information Centre
E-mail: informasjon@ssb.no
tel.: (+47) 21 09 46 42