Content
Published:
This is an archived release.
Sales of engine fuel at NOK 3 billion
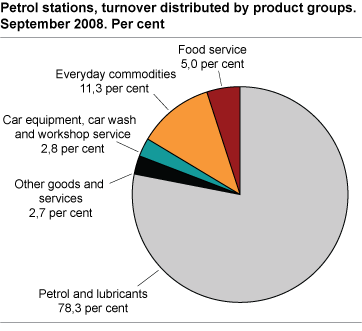
The petrol stations sold engine fuel and lubricants for more than NOK 3 billion in September 2008, a growth of 16.4 per cent compared with the same month in 2007. The increase was mainly due to higher petrol and diesel prices.
Compared to September 2007, the petrol stations’ turnover increased by 11.4 per cent, or NOK 400 million. The total turnover was NOK 3.9 billion in September this year.
NOK 35.4 billion during the first nine months
In the first nine months of this year, the petrol stations’ total turnover was NOK 35.4 billion, NOK 3.4 billion more than in the same period last year. This is equivalent to a growth of 10.7 per cent.
| Turnover | Change in per cent | ||||||||||||||||||||||||||||||||||||||
|---|---|---|---|---|---|---|---|---|---|---|---|---|---|---|---|---|---|---|---|---|---|---|---|---|---|---|---|---|---|---|---|---|---|---|---|---|---|---|---|
| September 2008 | January-September 2008 |
September 2007-
September 2008 |
January-September 2007-
January-September 2008 |
||||||||||||||||||||||||||||||||||||
| Total | 3 912 112 | 35 353 025 | 11.4 | 10.7 | |||||||||||||||||||||||||||||||||||
| Petrol and lubricants | 3 061 858 | 26 856 365 | 16.4 | 14.4 | |||||||||||||||||||||||||||||||||||
| Car equipment | 54 765 | 587 560 | -3.5 | -8.1 | |||||||||||||||||||||||||||||||||||
| Everyday commodities | 440 608 | 4 332 801 | -4.7 | 0.4 | |||||||||||||||||||||||||||||||||||
| Other goods including music and video sales | 77 397 | 870 362 | -9.5 | -6.8 | |||||||||||||||||||||||||||||||||||
| Food service | 196 483 | 1 786 890 | 0.4 | 3.3 | |||||||||||||||||||||||||||||||||||
| Workshop service and car wash | 53 186 | 659 888 | 9.0 | 4.9 | |||||||||||||||||||||||||||||||||||
| Renting | 10 365 | 96 965 | -11.9 | -9.3 | |||||||||||||||||||||||||||||||||||
| Games/commision | 17 450 | 161 911 | -7.8 | 28.9 | |||||||||||||||||||||||||||||||||||
Tables:
The statistics is published with Index of wholesale and retail sales.
Contact
-
Statistics Norway's Information Centre
E-mail: informasjon@ssb.no
tel.: (+47) 21 09 46 42