Content
Published:
This is an archived release.
Retail sales up 1.7 per cent
The seasonally adjusted volume index of retail sales increased by 1.7 per cent from January to February 2008.
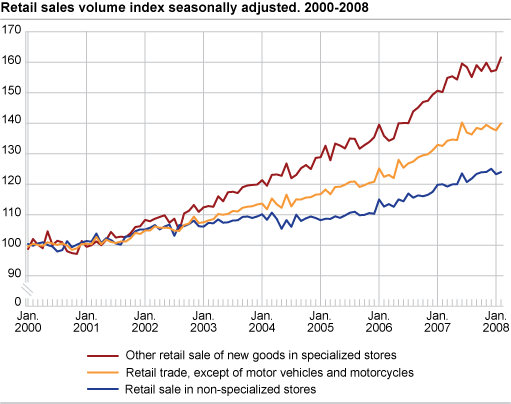
The volume index not adjusted rose by 10.1 per cent from February 2007 to February 2008. In the same period, the value index rose by 12.0 per cent.
| February 2008 | Per cent | ||||||||||||||||||||||||||||||||||||||
|---|---|---|---|---|---|---|---|---|---|---|---|---|---|---|---|---|---|---|---|---|---|---|---|---|---|---|---|---|---|---|---|---|---|---|---|---|---|---|---|
| January 2008-February 2008 | February 2007-February 2008 | March 2006-February 2007-March 2007-February 2008 | January -February 2007-January -February 2008 | ||||||||||||||||||||||||||||||||||||
| Retail sales value index exclude value added tax : Total excluding motor vehicles and petrol | 122.5 | 12.0 | 8.2 | 8.6 | |||||||||||||||||||||||||||||||||||
| Retail sales volume index: Total, excluding motor vehicles and petrol. Not seasonally adjusted numbers | 120.5 | 10.1 | 7.6 | 7.1 | |||||||||||||||||||||||||||||||||||
| Retail sales volume index: Total, excluding motor vehicles and petrol. Seasonally adjusted numbers | 140.0 | 1.7 | 5.6 | 7.3 | 4.6 | ||||||||||||||||||||||||||||||||||
Strongest increase in Denmark
A comparison of the seasonally adjusted volume indexes for the Scandinavian countries shows an increase of 2.0 per cent in Denmark from January to February 2008. In Sweden and Norway, the index increased by 1.7 per cent. From February 2007 to February 2008, the value index not adjusted rose by 12.0 per cent in Norway, 10.8 per cent in Sweden and 9.2 per cent in Denmark.
| Retail sales value index | Retail sales, volume index. Seasonally adjusted numbers | ||||||||||||||||||||||||||||||||||||||
|---|---|---|---|---|---|---|---|---|---|---|---|---|---|---|---|---|---|---|---|---|---|---|---|---|---|---|---|---|---|---|---|---|---|---|---|---|---|---|---|
| February 2008 |
Change in per cent.
February 2007- February 2008 |
February 2008 | Change in per cent | ||||||||||||||||||||||||||||||||||||
|
February 2007-
February 2008 |
January 2008-
February 2008 |
||||||||||||||||||||||||||||||||||||||
| Sweden | 103.9 | 10.8 | 116.3 | 4.9 | 1.7 | ||||||||||||||||||||||||||||||||||
| Denmark | 117.6 | 9.2 | 128.6 | 3.7 | 2.0 | ||||||||||||||||||||||||||||||||||
| Norway | 122.5 | 12.0 | 140.0 | 5.6 | 1.7 | ||||||||||||||||||||||||||||||||||
Contact
-
Anders Falla Aas
E-mail: anders.aas@ssb.no
tel.: (+47) 40 81 14 37
-
Edvard Garmannslund
E-mail: edvard.garmannslund@ssb.no
tel.: (+47) 48 99 77 82