Content
Published:
This is an archived release.
Low electoral turnout among immigrants
In the immigrant population, 40 per cent of Norwegian citizens and 36 per cent of foreign citizens participated in the local election last year. In the population as a whole, 62 per cent of the electorate participated. Immigrants from Eastern Europe had a particularly low turnout.
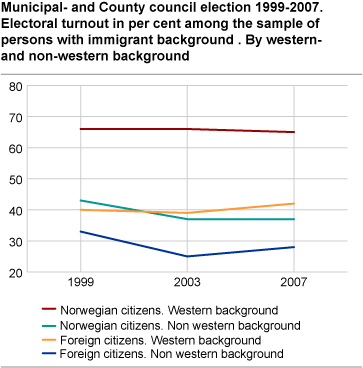
Compared with the 1999 and 2003 elections, there were only small changes in the electoral turnout in the immigrant population.
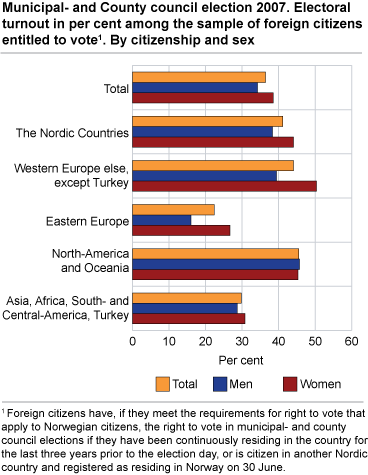
The electoral turnout was low both among foreign citizens with Western and non-Western immigrant background. 28 per cent of those with non-Western background voted, whereas 42 per cent voted among those with Western background. None of the country groups had a turnout above 50 per cent. Danish and German citizens had the highest turnout with 48 per cent, while citizens from Serbia and Bosnia had the lowest turnout with 16 and 18 per cent respectively. Eastern European citizens generally have a low turnout with 22 per cent on average. The turnout among non-Western citizens increased by 3 percentage points compared with 2003. With an increase of 13 percentage points to 36 per cent, Somali citizens had the largest increase in electoral turnout.
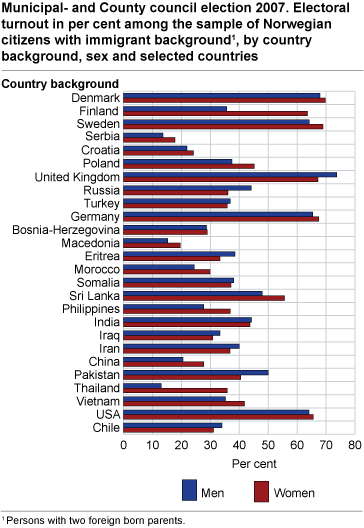
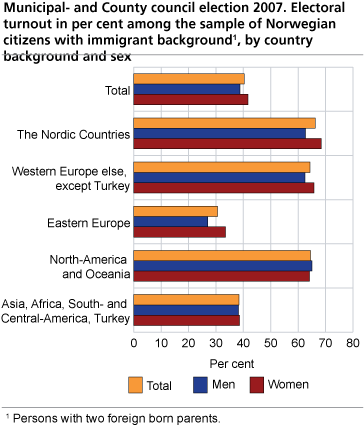
Norwegian citizens with immigrant background had a higher turnout than foreign citizens, particularly citizens with Western background. 64 per cent of Norwegian citizens with Western background voted, which is 2 percentage points higher than in the population as a whole. Among non-Western immigrants with Norwegian citizenship, 37 per cent voted, an increase of 1 percentage point from the last election.
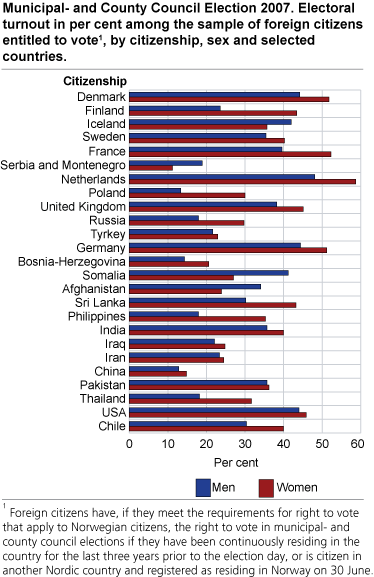
With an electoral turnout of 51 per cent, immigrants from Sri Lanka had the highest turnout among the non-Western immigrants, followed by Pakistan (46 per cent). Immigrants from Serbia had the lowest turnout with 16 per cent. Furthermore, only 31 per cent of Norwegian citizens with immigrant background from Eastern Europe voted. Compared with the 2003 election, Iranians had the largest increase (up 11 percentage points) whereas the turnout for Bosnians decreased by 12 percentage points.
Low turnout among young immigrants
As seen in previous elections, the turnout was markedly lower in the younger age groups. The main ‘rule’ is that the older the electorate, the higher the turnout. This has been true for immigrants and for the population as a whole. In the youngest age group (18-25 years), 23 per cent of Norwegian citizens voted and 18 per cent of foreign citizens with non-Western background. For the 2007 election, figures for the corresponding turnout in the population as a whole are not available, but in 2003, this figure was 38 per cent.
In the age group 40-59 years, the electoral turnout increased to 44 per cent for non-Western immigrants with Norwegian citizenship, whereas 33 per cent of foreign citizens with non-Western background voted. In the population as a whole, 65 per cent voted in this age group in 2003. Hence the difference in turnout is larger in the older age groups. Among the youngest age groups the difference was 15-20 percentage points, whereas among the older age groups the difference in turnout was 20-30 percentage points.
Slightly higher turnout for women
More women than men voted in the 2007 election. This particularly applied to immigrants from Eastern Europe. In this group, the turnout for women was 11 and 7 percentage points higher than for Norwegian and foreign citizens respectively. Also among non-Western immigrants in total women had higher turnout than men, however there are large differences between the country groups.
|
These figures are based on a survey of the electoral rolls for the municipal and county council election in 2007. A sample of 6 800 people was drawn from the electoral roll for the 141 500 Norwegian citizens with immigrant background. In addition, a sample of 6 800 people was drawn from the electoral roll for the 118 700 foreign citizens entitled to vote. The electoral turnout is calculated from the registrations in the electoral roll and should subsequently give a precise estimate of the actual turnout in the immigrant population. The survey has been commissioned by the Ministry of Labour and Social Inclusion. |
Tables:
- Table 1 Municipal- and County council election 2007. Electoral turnout in per cent among the sample of Norwegian citizens with immigrant background, by country background and sex
- Table 2 Municipal and county council election 2007. Electoral turnout in per cent among the sample of Norwegian citizens with immigrant background, by age and sex
- Table 3 Municipal and county council election 2007. Electoral turnout in per cent among the sample of Norwegian citizens with immigrant background, by years of residence and sex
- Table 4 Municipal and county council election 2007. Electoral turnout in per cent among the sample of Norwegian citizens with immigrant background, by country background and years of residence
- Table 5 Municipal and county council election 2007. Electoral turnout in per cent among the sample of Norwegian citizens with immigrant background, by county and sex
- Table 6 Municipal and county council election 2007. Electoral turnout in per cent among the sample of Norwegian citizens with immigrant background, by country background and age
- Table 7 Municipal and county council election 2007. Electoral turnout in per cent among the sample of Norwegian citizens with immigrant background, by part of the country/centrality/size of municipality and sex
- Table 8 Municipal and county council election 2007. Electoral turnout in per cent among the sample of foreign citizens entitled to vote, by citizenship and sex
- Table 9 Municipal and county council election 2007. Electoral turnout in per cent among the sample of foreign citizens entitled to vote, by age and sex
- Table 10 Municipal and county council election 2007. Electoral turnout in per cent among the sample of foreign citizens entitled to vote, by years of residence and sex
- Table 11 Municipal and county Council Election 2007. Electoral turnout in per cent among the sample of foreign citizen entitled to vote, by citizenship and years of residence.
- Table 12 Municipal and county council clection 2007. Electoral turnout in per cent among the sample of foreign citizens entitled to vote, by county and sex
- Table 13 Municipal and county council election 2007. Electoral turnout in per cent among the sample of foreign citizens entitled to vote, by country background and age
- Table 14 Municipal and county council election 2007. Electoral turnout in per cent among the sample of foreign citizens entitled to vote, by part of the country/centrality/size of municipality
- Table 15 Municipal and county council election 2007. Electoral turnout in per cent for groups with different citizenship and Norwegian citizens with immigrant background, by citizenship/country background and sex (Corrected 28 February 2008 at 1350)
- Table 16 Municipal and county council election 2007. Electoral turnout in per cent among the sample of Norwegian citizens with immigrant background, by urban district in Oslo and sex
The statistics is now published as Municipal and county council election, electoral survey.
Contact
-
Statistics Norway's Information Centre
E-mail: informasjon@ssb.no
tel.: (+47) 21 09 46 42