Content
Published:
This is an archived release.
Stable export prices
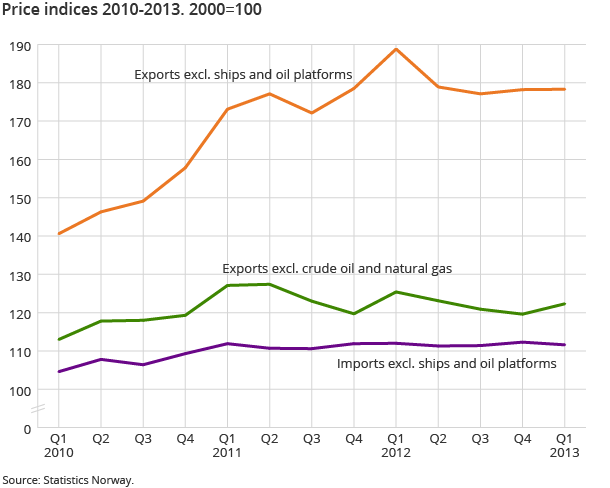
Prices of Norwegian exported goods were practically unchanged from the fourth quarter of 2012 to the first quarter of 2013, and were relatively stable over the previous three quarters. Import prices fell by a moderate 0.6 per cent in the first quarter of 2013.
| Volume index | Price index | |||
|---|---|---|---|---|
| Exports | Imports | Exports | Imports | |
| 1Groups according to the Standard International Trade Classification (SITC-Rev. 4). | ||||
| 1st quarter 2013 / 4th quarter 2012 | ||||
| Goods excl. ships and oil platforms | -4.0 | -7.9 | 0.1 | -0.6 |
| Exports excl. crude oil and natural gas | -2.4 | . | 2.3 | . |
| Food, beverages and tobacco | -23.9 | -11.2 | 13.9 | -0.8 |
| Crude materials except fuels | -14.9 | -1.8 | 2.1 | -5.5 |
| Fuels | -2.2 | -3.3 | -1.4 | 3.2 |
| Manufactured goods except food, beverages and tobacco | -1.1 | -8.6 | 0.1 | -0.3 |
Prices of Norwegian exports of goods have been relatively stable since the second quarter of 2012, after the oil price spiked in the first quarter of last year. The price index for exports changed from 178.2 in the fourth quarter of 2012 to 178.3 in the first quarter of 2013, which means prices overall were virtually unchanged. The price index for the fourth quarter has been revised upwards slightly since it was first released in January, mainly due to new information on prices of electricity and some metal products.
Prices of important export goods such as natural gas and chemical products fell in the year’s first quarter, by 5.3 and 4.3 per cent respectively. For petroleum and petroleum products, as well as fish, prices moved in the opposite direction, with increases of 2.1 and 15.1 per cent. Excluding oil and natural gas, the price index increased by 2.3 per cent, mainly due to higher fish prices.
Lower export prices over the past year
Compared with the first quarter of 2012, prices of Norwegian exports were 5.6 per cent lower in the first quarter this year. The fall mainly stems from prices for oil, natural gas and metals declining by approximately seven per cent over the four quarters. One of the important export goods with higher prices was fish, for which prices increased by 7.5 per cent.
Less exported goods
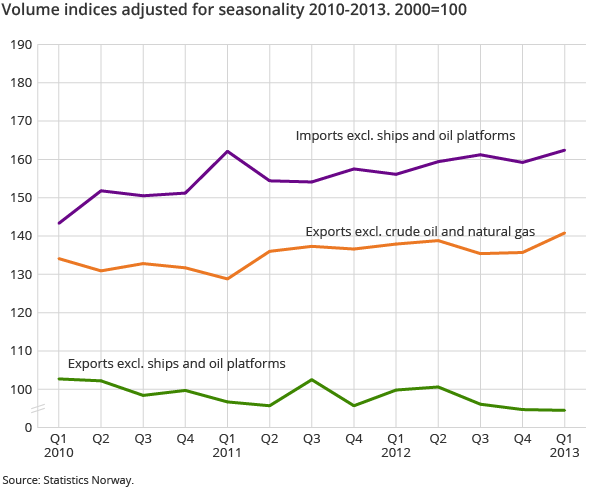
The volume of Norwegian exports was four per cent lower in the first quarter this year than in the last quarter of 2012. The most important decline occurred for fish, and is related to the usual drop in exports during Easter. The exported volume of fish fell by 24.8 per cent from the fourth to the first quarter. Exports of oil, natural gas and electric power also declined. Excluding oil and natural gas, and adjusting for the usual seasonal variations, the seasonally-adjusted index shows an increase of 2.8 per cent in export volume.
Compared with the first quarter in 2012, exports were 8.6 less in the first quarter this year. Exports of fish also contributed to reducing this number, as Easter fell in the second quarter of 2012 and in the first quarter of 2013. For oil and natural gas, exports fell by around 11 per cent over the four quarters.
Slightly lower import prices
Prices of imported goods fell somewhat, both compared with the previous quarter and with the same quarter of 2012. Following a sharp increase in 2010, import prices have been relatively stable since 2011, perhaps with a slightly increasing trend. The Norwegian krone has appreciated by approximately four per cent over the same period, according to the Norwegian Central Bank’s import-weighted exchange rate index.
The total import price index fell by 0.6 per cent from the fourth to the first quarter. Prices declined for most groups of goods, but the price of electric power increased by 12.2 per cent. Relative to the first quarter of 2012, import prices were 0.4 per cent lower in the same quarter in 2013.
Falling imports
It is not unusual for the volume of imports to fall from the fourth to the first quarter. This year the overall decline was 7.9 per cent. Imports fell for most kinds of goods, with a notable exception for electric power, which increased by 57.8 per cent. Imports of electricity were almost three times higher than in the first quarter of 2012.
The total decline in imports of goods since the first quarter of last year was 0.4 per cent. Even though imports of some finished goods such as clothing, footwear, road vehicles and computer equipment grew, the fall in imports of other goods was large enough to reduce total imports. Chemical products and metals were two of the groups with the most significant declines.
Contact
-
Morten Madshus
E-mail: morten.madshus@ssb.no
tel.: (+47) 40 90 26 94
-
Mats Halvorsen
E-mail: mats.halvorsen@ssb.no
tel.: (+47) 40 90 24 33


