Content
Published:
This is an archived release.
Lower prices of exported goods
Prices of Norwegian exported goods fell by 1.1 per cent from the third to the fourth quarter in 2012. This is the third consecutive quarter of declining prices.
Ships and oil platforms are excluded in all figures for exports and imports of goods. |
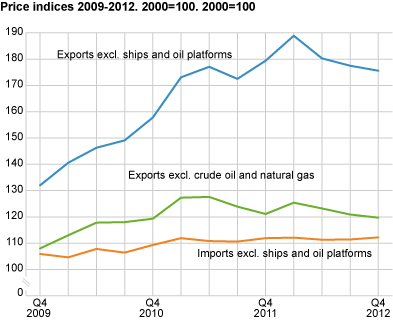
Lower prices for several important export goods caused the price index for Norwegian exports to fall by 1.1 per cent from the third to the fourth quarter. The price of crude oil fell by 3.9 per cent, but even the index excluding oil and natural gas fell by one per cent. Export prices of fish have fallen continuously since the beginning of 2011, and in the last quarter of 2012 they fell by another 1.2 per cent. Compared to the fourth quarter of 2011, Norwegian exporters’ prices were 2.1 per cent lower in the last quarter of 2012.
Despite lower export prices in the fourth quarter, both compared to the previous quarter and the same quarter of 2011, the index for the entire year was still higher in 2012 than in 2011. This was due to increased prices of oil and natural gas. Excluding these goods the index was 2.1 per cent lower than the previous year. The falling prices of fish have already been mentioned, and exporters of metals also saw prices fall from 2011 to 2012.
Small increase in import prices
The price index for imported goods was 0.7 per cent higher in the fourth quarter than in the third. Crude materials, manufactures of metals and electrical machinery and apparatus were the groups of goods with the largest price increases. Compared with the fourth quarter of 2011, import prices were 0.3 per cent higher in the last quarter of 2012.
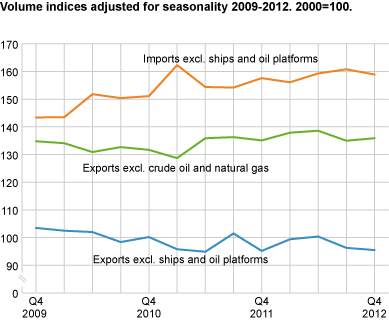
Increased export volume
The volume index for exports showed a 10.5 per cent increase in Norwegian exports from the third to the fourth quarter. Some of the increase is due to seasonal variations in the exports of fish and natural gas. Adjusted for seasonality, the index fell by 0.8 per cent. Compared to the fourth quarter of the previous year, exports were 0.1 per cent higher. Falling exports of oil and chemical products contributed to keep the overall growth rate low.
For the year as a whole, the export volume in 2012 was 1.1 per cent higher than the previous year. This is the first annual increase in Norwegian exports since 2008, and was due to increased exports of fish, natural gas and machinery and transport equipment.
Continued increase in imports
The volume of goods shipped to Norway increased by 4.4 per cent from the third to the fourth quarter. It is normal for imports to increase in a year’s final quarter. Adjusted for seasonality, the volume index fell by 1.2 per cent. Compared with the fourth quarter of 2011, imports were 0.8 per cent higher in the last quarter of 2012. Over the entire year, Norway’s imports were 1.1 per cent higher than the previous year. The volume of imports increased for most groups of goods, but some notable exceptions were crude materials and chemical products; goods that are often used as inputs in Norwegian manufacturing industries.
| Commodity group 1 | Commodity SITC | Volume | Price | ||||||||||||||||||||||||||||||||||||||||||||||||||||||||||||||||||||||||||||
|---|---|---|---|---|---|---|---|---|---|---|---|---|---|---|---|---|---|---|---|---|---|---|---|---|---|---|---|---|---|---|---|---|---|---|---|---|---|---|---|---|---|---|---|---|---|---|---|---|---|---|---|---|---|---|---|---|---|---|---|---|---|---|---|---|---|---|---|---|---|---|---|---|---|---|---|---|---|---|---|
| 4th quarter 2012 | 4th quarter 2011-4th quarter 2012. Change in per cent | 4th quarter 2012 | 4th quarter 2011-4th quarter 2012. Change in per cent | ||||||||||||||||||||||||||||||||||||||||||||||||||||||||||||||||||||||||||||
| Imports | |||||||||||||||||||||||||||||||||||||||||||||||||||||||||||||||||||||||||||||||
| Total | 0-9 | 164.9 | 0.8 | 112.2 | 0.3 | ||||||||||||||||||||||||||||||||||||||||||||||||||||||||||||||||||||||||||
| Of which | |||||||||||||||||||||||||||||||||||||||||||||||||||||||||||||||||||||||||||||||
| Food, beverages and tobacco | 0-1 | 182.4 | 3.5 | 129.7 | 0.9 | ||||||||||||||||||||||||||||||||||||||||||||||||||||||||||||||||||||||||||
| Crude materials except fuels | 2, 4 | 134.0 | -4.3 | 118.8 | -4.8 | ||||||||||||||||||||||||||||||||||||||||||||||||||||||||||||||||||||||||||
| Fuels | 3 | 131.1 | 12.6 | 223.4 | -3.4 | ||||||||||||||||||||||||||||||||||||||||||||||||||||||||||||||||||||||||||
| Manufactured goods except food, beverages and tobacco | 5-9 | 168.2 | 0.4 | 105.9 | 0.8 | ||||||||||||||||||||||||||||||||||||||||||||||||||||||||||||||||||||||||||
| Exports | |||||||||||||||||||||||||||||||||||||||||||||||||||||||||||||||||||||||||||||||
| Total | 0-9 | 99.8 | 0.1 | 175.6 | -2.1 | ||||||||||||||||||||||||||||||||||||||||||||||||||||||||||||||||||||||||||
| Of which | |||||||||||||||||||||||||||||||||||||||||||||||||||||||||||||||||||||||||||||||
| Food, beverages and tobacco | 0-1 | 195.3 | 9.4 | 99.9 | -5.9 | ||||||||||||||||||||||||||||||||||||||||||||||||||||||||||||||||||||||||||
| Crude materials except fuels | 2, 4 | 165.7 | 23.6 | 116.8 | -10.8 | ||||||||||||||||||||||||||||||||||||||||||||||||||||||||||||||||||||||||||
| Fuels | 3 | 80.8 | -1.3 | 230.5 | -1.5 | ||||||||||||||||||||||||||||||||||||||||||||||||||||||||||||||||||||||||||
| Manufactured goods except food, beverages and tobacco | 5-9 | 134.2 | 0.4 | 106.9 | -2.2 | ||||||||||||||||||||||||||||||||||||||||||||||||||||||||||||||||||||||||||
| Exports excl. crude oil and natural gas | 139.7 | 0.4 | 119.7 | -1.2 | |||||||||||||||||||||||||||||||||||||||||||||||||||||||||||||||||||||||||||
| 1 | Groups according to the Standard International Trade Classification (SITC-Rev. 4). |
Contact
-
Morten Madshus
E-mail: morten.madshus@ssb.no
tel.: (+47) 40 90 26 94
-
Mats Halvorsen
E-mail: mats.halvorsen@ssb.no
tel.: (+47) 40 90 24 33