Content
Published:
This is an archived release.
Lower prices of exported and imported goods
From the first quarter of 2012 to the second quarter 2012, prices of Norwegian exports and imports of goods decreased by 3.3 and 0.9 per cent respectively.
|
Ships and oil platforms are excluded in all figures for exports and imports of goods. |
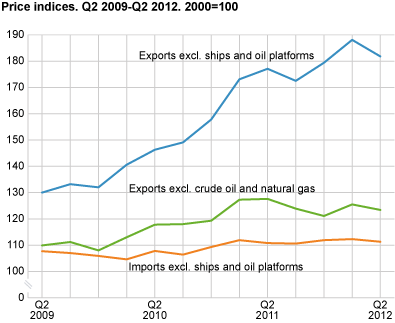
The decline in prices of exported goods was caused by a 6.6 per cent drop in prices of petroleum and petroleum products from the first quarter of 2012 to the second quarter of 2012. Excluding crude oil and natural gas, export prices fell by 1.7 per cent. Lower prices in machinery and transport equipment together with non-ferrous metals were also important to the overall decrease in export prices. Here prices fell by 2.3 and 4 per cent respectively. Prices declined in most groups of machinery and transport equipment from the first quarter of 2012 to the second quarter of 2012. Compared with the second quarter of 2011, Norwegian export prices increased by 2.7 per cent, but excluding crude oil and natural gas, export prices fell by 3.3 per cent.
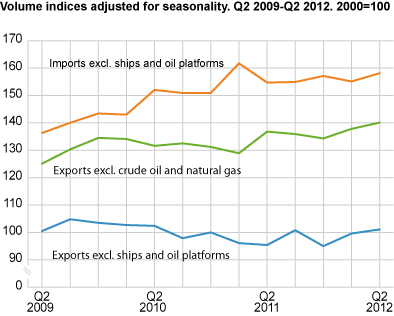
The total volume of exported goods decreased by 7 per cent from the first to the second quarter this year. A decrease in the volume of exported petroleum and petroleum products together with natural and manufactured gas were important to the total decrease in the exported volume. Adjusted for seasonal variations, there is still a small increase of 1.5 per cent from the first to the second quarter of 2012. Compared with the second quarter of 2011, the volume of exported goods increased by 6 per cent and by 2.6 per cent when crude oil and natural gas is excluded.
Import prices down 0.9 per cent
Prices in imported goods decreased by 0.9 per cent compared to the first quarter this year. Prices fell in commodity groups such as machinery and transport equipment, miscellaneous manufactured articles, manufactured goods as well as crude materials (except fuels). Although these commodity groups showed a decline in prices, the price development in the various sub-groups differed somewhat. For example, for manufactured goods, prices of non-ferrous metals dropped by 4.3 per cent, while prices in iron and steel and rubber manufactures increased. Import prices in non-ferrous metals have declined since the first quarter of 2011, with a total decrease of 11.8 per cent. Chemicals and related products is distinguished with a price growth of 1.2 per cent compared to the previous quarter. Although prices of imported goods declined from the first to the second quarter this year, import prices increased slightly compared with the second quarter of 2011.
The total volume of imports increased by 3.9 per cent from the first quarter of 2012 to the second quarter of 2012. Except for food and miscellaneous manufactured articles, the volume of imports increased in all commodity groups. From the second quarter of 2011 to the second quarter of 2012 the total volume of imports increased by 2.4 per cent. Chemicals and related products together with crude materials (except fuels) are the only commodity groups in which the volume decreased in this period.
| Commodity group1 |
Commodity
SITC |
Volume | Price | ||||||||||||||||||||||||||||||||||||||||||||||||||||||||||||||||||||||||||||
|---|---|---|---|---|---|---|---|---|---|---|---|---|---|---|---|---|---|---|---|---|---|---|---|---|---|---|---|---|---|---|---|---|---|---|---|---|---|---|---|---|---|---|---|---|---|---|---|---|---|---|---|---|---|---|---|---|---|---|---|---|---|---|---|---|---|---|---|---|---|---|---|---|---|---|---|---|---|---|---|
| 2nd quarter 2012 |
2nd quarter 2011-
2nd quarter 2012. Change in per cent |
2nd quarter 2012 |
2nd quarter 2011-
2nd quarter 2012. Change in per cent |
||||||||||||||||||||||||||||||||||||||||||||||||||||||||||||||||||||||||||||
| Imports | |||||||||||||||||||||||||||||||||||||||||||||||||||||||||||||||||||||||||||||||
| Total | 0-9 | 158.0 | 2.4 | 111.3 | 0.5 | ||||||||||||||||||||||||||||||||||||||||||||||||||||||||||||||||||||||||||
| Of which | |||||||||||||||||||||||||||||||||||||||||||||||||||||||||||||||||||||||||||||||
| Food, beverages and tobacco | 0-1 | 164.7 | 6.1 | 129.0 | -0.5 | ||||||||||||||||||||||||||||||||||||||||||||||||||||||||||||||||||||||||||
| Crude materials except fuels | 2, 4 | 145.0 | 2.2 | 119.3 | -8.9 | ||||||||||||||||||||||||||||||||||||||||||||||||||||||||||||||||||||||||||
| Fuels | 3 | 122.9 | 7.0 | 237.7 | 4.8 | ||||||||||||||||||||||||||||||||||||||||||||||||||||||||||||||||||||||||||
| Manufactured goods except food, beverages and tobacco | 5-9 | 160.3 | 1.8 | 104.5 | 1.2 | ||||||||||||||||||||||||||||||||||||||||||||||||||||||||||||||||||||||||||
| Exports | |||||||||||||||||||||||||||||||||||||||||||||||||||||||||||||||||||||||||||||||
| Total | 0-9 | 97.0 | 6.0 | 181.8 | 2.7 | ||||||||||||||||||||||||||||||||||||||||||||||||||||||||||||||||||||||||||
| Of which | |||||||||||||||||||||||||||||||||||||||||||||||||||||||||||||||||||||||||||||||
| Food, beverages and tobacco | 0-1 | 139.8 | 12.7 | 105.4 | -13.9 | ||||||||||||||||||||||||||||||||||||||||||||||||||||||||||||||||||||||||||
| Crude materials except fuels | 2, 4 | 136.6 | 2.9 | 129.4 | 2.9 | ||||||||||||||||||||||||||||||||||||||||||||||||||||||||||||||||||||||||||
| Fuels | 3 | 80.5 | 9.4 | 237.8 | 4.8 | ||||||||||||||||||||||||||||||||||||||||||||||||||||||||||||||||||||||||||
| Manufactured goods except food, beverages and tobacco | 5-9 | 135.2 | -2.2 | 109.0 | -0.9 | ||||||||||||||||||||||||||||||||||||||||||||||||||||||||||||||||||||||||||
| Exports excl. crude oil and natural gas | 136.6 | 2.6 | 123.4 | -3.3 | |||||||||||||||||||||||||||||||||||||||||||||||||||||||||||||||||||||||||||
| 1 | Groups according to the Standard International Trade Classification (SITC-Rev. 4). |
Contact
-
Morten Madshus
E-mail: morten.madshus@ssb.no
tel.: (+47) 40 90 26 94
-
Mats Halvorsen
E-mail: mats.halvorsen@ssb.no
tel.: (+47) 40 90 24 33