Content
Published:
This is an archived release.
Higher export prices
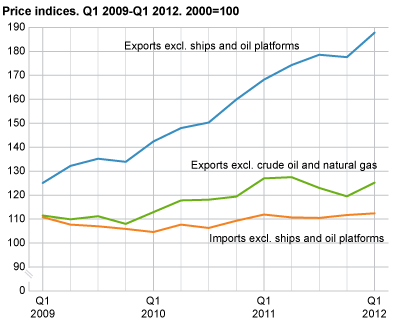
Prices of Norwegian exports of goods increased by 4.7 per cent from the fourth quarter of 2011 to the first quarter of 2012. Higher prices of oil and natural gas were important for the overall growth, but prices also increased for machinery and transport equipment and non-ferrous metals.
|
Ships and oil platforms are excluded in all figures for exports and imports of goods. |
Prices of petroleum and petroleum products grew by 8.8 per cent from the last quarter of 2011 to the first quarter of 2012, contributing to a 4.7 per cent increase in the overall price index for Norwegian exports of goods. Excluding oil and natural gas, the index rose by 3.4 per cent, due to higher prices of machinery, transport equipment and non-ferrous metals. Most other groups of goods saw prices decline. Prices of fish and chemical products, for example, fell by 0.6 and 5.4 per cent respectively.
Compared with the first quarter of 2011, Norwegian export prices were 8.5 per cent higher in the first quarter of 2012. Excluding oil and natural gas, the price index fell by 1.6 per cent over the year to the first quarter.
Higher exports of oil and gas, lower exports of other goods
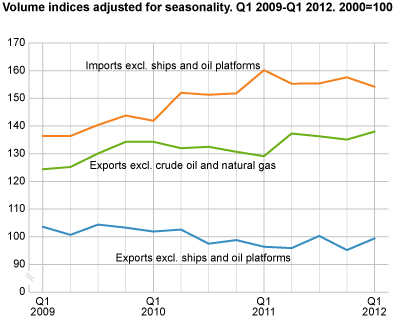
The volume index for Norwegian exports shows that overall exports increased by 4.8 per cent from the last quarter of 2011 to the first of 2012. The growth is mainly due to higher exports of oil and natural gas. Exports of other goods fell by 0.6 per cent.
Since the first quarter of 2011, the export volume increased by 3.8 per cent. Over this period, the export of oil has decreased, while that of natural gas has grown. Excluding these important goods, Norwegian exports were 7.1 per cent higher than one year before. Shipments of fish increased by 13.8 per cent, while the export of electric power was more than 20 times higher than one year ago, due to record production levels.
Small increase in import prices
Prices for Norwegian imports of goods rose by 0.4 per cent from the fourth quarter of 2011 to the first quarter of 2012. Lower prices of inedible crude materials except fuels dampened the overall price growth, while most other groups of goods had small price increases.
Compared with the first quarter of 2011 import prices were also 0.4 per cent lower. Prices of crude materials and food have fallen over the past year, keeping the overall price growth low.
Lower import volume
The volume of goods imported fell by 7.5 per cent from the fourth quarter of 2011 to the first quarter of 2012. Norway imported 12.4 per cent less machinery and transport equipment than in the previous quarter. Even when adjusted for normal seasonal variations the index shows a decline in the imports of most groups of goods.
Since the first quarter of 2011, the volume of Norwegian imports has fallen by 4.4 per cent, due to lower imports of crude materials and fuels. The imports of food, beverages and tobacco grew by 8.7 per cent over the same period.
As of the publication of data for the first quarter of 2012, all price and volume indices for external trade have been revised back to 2009. For more on the data revisions, see statistics on external trade in goods .
| Commodity group1 |
Commodity
SITC |
Volume | Price | ||||||||||||||||||||||||||||||||||||||||||||||||||||||||||||||||||||||||||||
|---|---|---|---|---|---|---|---|---|---|---|---|---|---|---|---|---|---|---|---|---|---|---|---|---|---|---|---|---|---|---|---|---|---|---|---|---|---|---|---|---|---|---|---|---|---|---|---|---|---|---|---|---|---|---|---|---|---|---|---|---|---|---|---|---|---|---|---|---|---|---|---|---|---|---|---|---|---|---|---|
| 1st quarter 2012 |
1st quarter 2011-
1st quarter 2012. Change in per cent |
1st quarter 2012 |
1st quarter 2011-
1st quarter 2012. Change in per cent |
||||||||||||||||||||||||||||||||||||||||||||||||||||||||||||||||||||||||||||
| Imports | |||||||||||||||||||||||||||||||||||||||||||||||||||||||||||||||||||||||||||||||
| Total | 0-9 | 151.4 | -4.4 | 112.4 | 0.4 | ||||||||||||||||||||||||||||||||||||||||||||||||||||||||||||||||||||||||||
| Of which | |||||||||||||||||||||||||||||||||||||||||||||||||||||||||||||||||||||||||||||||
| Food, beverages and tobacco | 0-1 | 160.1 | 8.7 | 131.9 | 1.1 | ||||||||||||||||||||||||||||||||||||||||||||||||||||||||||||||||||||||||||
| Crude materials except fuels | 2, 4 | 137.0 | -18.4 | 122.0 | -12.0 | ||||||||||||||||||||||||||||||||||||||||||||||||||||||||||||||||||||||||||
| Fuels | 3 | 95.3 | -44.5 | 240.5 | 5.4 | ||||||||||||||||||||||||||||||||||||||||||||||||||||||||||||||||||||||||||
| Manufactured goods except food, beverages and tobacco | 5-9 | 156.2 | 0.7 | 105.2 | 2.1 | ||||||||||||||||||||||||||||||||||||||||||||||||||||||||||||||||||||||||||
| Exports | |||||||||||||||||||||||||||||||||||||||||||||||||||||||||||||||||||||||||||||||
| Total | 0-9 | 104.5 | 3.8 | 187.8 | 8.5 | ||||||||||||||||||||||||||||||||||||||||||||||||||||||||||||||||||||||||||
| Of which | |||||||||||||||||||||||||||||||||||||||||||||||||||||||||||||||||||||||||||||||
| Food, beverages and tobacco | 0-1 | 155.8 | 12.9 | 105.5 | -16.3 | ||||||||||||||||||||||||||||||||||||||||||||||||||||||||||||||||||||||||||
| Crude materials except fuels | 2, 4 | 137.8 | 10.2 | 130.5 | 2.9 | ||||||||||||||||||||||||||||||||||||||||||||||||||||||||||||||||||||||||||
| Fuels | 3 | 88.8 | 3.4 | 248.7 | 15.2 | ||||||||||||||||||||||||||||||||||||||||||||||||||||||||||||||||||||||||||
| Manufactured goods except food, beverages and tobacco | 5-9 | 135.0 | 0.7 | 108.7 | -2.4 | ||||||||||||||||||||||||||||||||||||||||||||||||||||||||||||||||||||||||||
| Exports excl. crude oil and natural gas | 138.2 | 7.1 | 125.2 | -1.6 | |||||||||||||||||||||||||||||||||||||||||||||||||||||||||||||||||||||||||||
| 1 | Groups according to the Standard International Trade Classification (SITC-Rev. 4). |
Contact
-
Morten Madshus
E-mail: morten.madshus@ssb.no
tel.: (+47) 40 90 26 94
-
Mats Halvorsen
E-mail: mats.halvorsen@ssb.no
tel.: (+47) 40 90 24 33


