Content
Published:
This is an archived release.
Norwegian import prices continue to fall
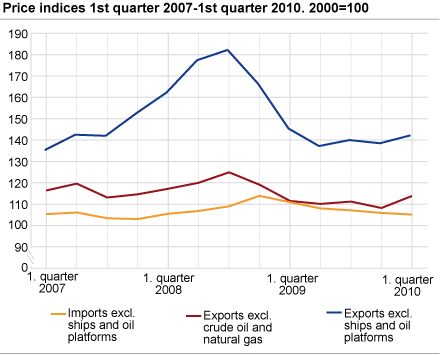
Prices of imported goods fell by 0.8 per cent from the fourth quarter in 2009 to the first quarter in 2010. This was the fifth consecutive quarter with reduced import prices. For Norwegian exports of goods, prices increased slightly since the previous quarter.
Ships and oil platforms are excluded in all figures for exports and imports of goods. |
From the fourth quarter of 2009 to the first quarter of 2010, prices of Norwegian imports fell by 0.8 per cent, according to indices of volume and price for external merchandise trade. Since a peak in the fourth quarter of 2008, Norway has seen five consecutive quarters of import price decrease. The price fall is probably closely related to an appreciation of the Norwegian Krone since the fourth quarter of 2008 of about 10 per cent.
Prices fell in a wide range of product groups from the fourth quarter of 2009 to the first quarter this year. Some of the most notable exceptions were food, a few crude materials and electric current. A price decrease of 1.5 per cent for chemical products played a large role in bringing the overall price level down. Other important product groups with lower prices were iron and steel, together with manufactures of metals, where prices fell by 2.1 and 5.7 per cent respectively.
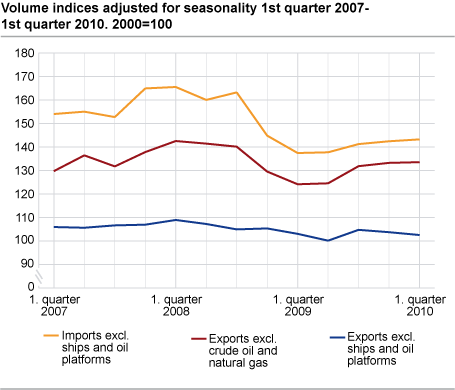
The volume of Norwegian imports was 6.4 per cent lower in the first quarter of 2010 than in the previous quarter. It is not unusual for imports to fall from the fourth to the first quarter. When adjusted for seasonal variations, imports increased by 0.6 per cent. Compared with the first quarter of 2009, the volume was 3.9 per cent higher in the first quarter this year. One of the most important reasons for this increase was imports of road vehicles, which increased from a very low level in early 2009.
Higher prices for exports
Prices achieved by Norwegian exporters were 2.2 per cent higher in the first quarter of 2010 than in the previous quarter. Important export goods such as fish, crude oil, oil products and non-ferrous metals saw prices increase.
Compared with the first quarter of last year, however, export prices were lower, despite the growth in the last quarter. With a few notable exceptions for crude oil, electric current and non-ferrous metals prices fell for most product groups over this time period.
Lower export volumes
The volume of Norwegian merchandise exports decreased by 0.4 per cent from the fourth quarter of 2009 to the first quarter of 2010. Foreign sales volumes fell for iron, steel, machinery and equipment, among other product groups. Exports of fish also fell from the last quarter of 2009, but were still at a high level. Compared with the first quarter of 2009, exports of fish were 17.6 per cent higher in the first quarter of 2010.
Norwegian export volumes overall were 0.4 per cent lower compared with the first quarter of 2009. Volumes fell for important product groups such as crude oil, oil products, machinery and equipment. Over the same period, there were several less sizeable product groups which saw exports increase.
| Commodity group 1 | Commodity SITC | Volume | Price | ||||||||||||||||||||||||||||||||||||||||||||||||||||||||||||||||||||||||||||
|---|---|---|---|---|---|---|---|---|---|---|---|---|---|---|---|---|---|---|---|---|---|---|---|---|---|---|---|---|---|---|---|---|---|---|---|---|---|---|---|---|---|---|---|---|---|---|---|---|---|---|---|---|---|---|---|---|---|---|---|---|---|---|---|---|---|---|---|---|---|---|---|---|---|---|---|---|---|---|---|
| 1st quarter 2010 | 1st quarter 2009-2010. Change in per cent | 1st quarter 2010 | 1st quarter 2009-2010. Change in per cent | ||||||||||||||||||||||||||||||||||||||||||||||||||||||||||||||||||||||||||||
| Imports | |||||||||||||||||||||||||||||||||||||||||||||||||||||||||||||||||||||||||||||||
| Total | 0-9 | 140.3 | 3.9 | 105.1 | -5.2 | ||||||||||||||||||||||||||||||||||||||||||||||||||||||||||||||||||||||||||
| Of which | |||||||||||||||||||||||||||||||||||||||||||||||||||||||||||||||||||||||||||||||
| Food, beverages and tobacco | 0-1 | 137.2 | 2.6 | 122.0 | -5.4 | ||||||||||||||||||||||||||||||||||||||||||||||||||||||||||||||||||||||||||
| Crude materials except fuels | 2, 4 | 132.7 | 24.3 | 106.8 | -5.8 | ||||||||||||||||||||||||||||||||||||||||||||||||||||||||||||||||||||||||||
| Fuels | 3 | 108.0 | -23.1 | 184.2 | 30.9 | ||||||||||||||||||||||||||||||||||||||||||||||||||||||||||||||||||||||||||
| Manufactured goods except food, beverages and tobacco | 5-9 | 142.4 | 4.9 | 101.0 | -7.5 | ||||||||||||||||||||||||||||||||||||||||||||||||||||||||||||||||||||||||||
| Exports | |||||||||||||||||||||||||||||||||||||||||||||||||||||||||||||||||||||||||||||||
| Total | 0-9 | 108.0 | -0.4 | 140.8 | -2.2 | ||||||||||||||||||||||||||||||||||||||||||||||||||||||||||||||||||||||||||
| Of which | |||||||||||||||||||||||||||||||||||||||||||||||||||||||||||||||||||||||||||||||
| Food, beverages and tobacco | 0-1 | 147.3 | 16.4 | 104.7 | 0.2 | ||||||||||||||||||||||||||||||||||||||||||||||||||||||||||||||||||||||||||
| Crude materials except fuels | 2, 4 | 110.8 | 19.0 | 107.3 | -3.8 | ||||||||||||||||||||||||||||||||||||||||||||||||||||||||||||||||||||||||||
| Fuels | 3 | 94.6 | -3.3 | 165.6 | -1.9 | ||||||||||||||||||||||||||||||||||||||||||||||||||||||||||||||||||||||||||
| Manufactured goods except food, beverages and tobacco | 5-9 | 137.2 | 4.8 | 103.9 | -5.5 | ||||||||||||||||||||||||||||||||||||||||||||||||||||||||||||||||||||||||||
| Exports excl. crude oil and natural gas | 134.2 | 7.3 | 113.8 | 2.1 | |||||||||||||||||||||||||||||||||||||||||||||||||||||||||||||||||||||||||||
| 1 | Groups according to the Standard International Trade Classification (SITC-Rev. 4). |
Contact
-
Morten Madshus
E-mail: morten.madshus@ssb.no
tel.: (+47) 40 90 26 94
-
Mats Halvorsen
E-mail: mats.halvorsen@ssb.no
tel.: (+47) 40 90 24 33


