Content
Published:
This is an archived release.
Higher import prices on crude materials
Import prices of goods excluding ships and oil platforms increased by 9.0 per cent from the second quarter of 2006 to the second quarter of 2007. The growth in export prices were 3.8 per cent in the same period. Import prices were higher due to increased prices on crude materials.
Higher import prices were recorded for food, crude materials and manufactured goods. The growth in import prices for crude materials was mainly due to increased prices of metalliferous ores and metal scrap, and the price has increased by 87 per cent from the second quarter last year. Among food products, fish and vegetables increased the most, by 12 and 8 per cent, respectively. The import prices of iron and steel has increased by 29 per cent from the second quarter of 2006.
Higher imports of machinery and metals
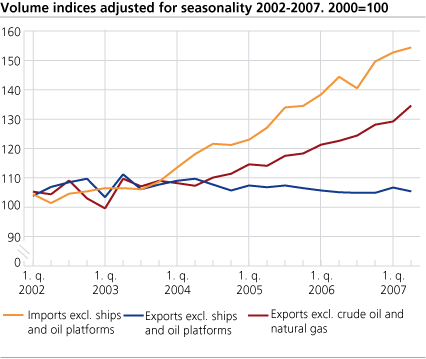
The import volume of goods excluding ships and oil platforms increased by 6.8 per cent from the second quarter of 2006 to the second quarter of this year. Imports were higher in most groups, with fuels such as petroleum showing the largest increase. The import volume of office machines and road vehicles also showed increased as well, while a decline was registered for office machines and telecommunications apparatus. For iron and steel, the growth in import volume was 29 per cent.
Adjusted for seasonality, the figures also show an increasing import volume from the first to the second quarter this year. However, the 1.1 per cent increase was minor compared with the 2.1 per cent increase in the previous quarter.
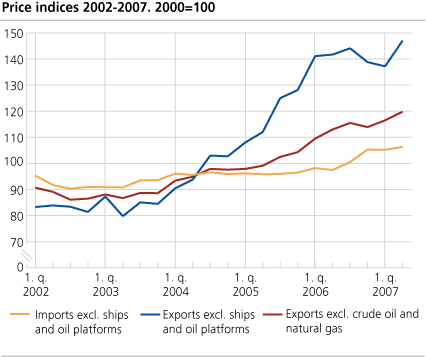
Export prices: metals and crude materials up, fish down
The export prices of goods excluding crude oil, condensates, natural gas, ships and oil platforms went up by 3.8 per cent from the second quarter of 2006 to the second quarter in 2007. Excluding crude oil, condensates, natural gas as well, the export prices showed an increase by 6.0 per cent. Export prices were higher for iron and steel, up 35 per cent. For crude materials such as wood, lumber and cork and metalliferous ores the prices went up, 25 and 14 per cent, respectively.
The export volume of fish went down by 16 per cent compared with the second quarter of 2006.
Increased exports of metals and machinery, less fuels
From the second quarter of 2006 to the second quarter in 2007, the export volume of goods excluding ships and oil platforms increased slightly by 0.2 per cent. Less export of crude oil was the main reason.
The export volume of goods excluding crude oil, condensates, natural gas, ships and oil platforms increased by 9.9 per cent from the second quarter last year to the second quarter this year. The 15 per cent increase in food exports explains most of the increase, whereby fish showed an increase of 18 per cent. Manufactured goods, such as manufactured of metals and machinery for special industries increased the most.
Adjusted for seasonality, export volume of goods excluding crude oil, condensates, natural gas, ships and oil platforms show an increase of 4.2 per cent from the first to the second quarter this year.
|
External trade in commodities excl. ships and oil platforms. Indices of price and volume.
2nd quarter 2007 |
| Commodity group1 | Commodity SITC | Volume | Price | ||||||||||||||||||||||||||||||||||||
|---|---|---|---|---|---|---|---|---|---|---|---|---|---|---|---|---|---|---|---|---|---|---|---|---|---|---|---|---|---|---|---|---|---|---|---|---|---|---|---|
| 2nd quarter 2007 | 2nd quarter 2006 and 2007. Change in per cent | 2nd quarter 2007 | 2nd quarter 2006 and 2007. Change in per cent | ||||||||||||||||||||||||||||||||||||
| Imports | |||||||||||||||||||||||||||||||||||||||
| Total | 0-9 | 153.4 | 6.8 | 106.3 | 9.0 | ||||||||||||||||||||||||||||||||||
| Of which | |||||||||||||||||||||||||||||||||||||||
| Food, beverages and tobacco | 0-1 | 140.6 | 11.0 | 115.1 | 8.7 | ||||||||||||||||||||||||||||||||||
| Crude materials except fuels | 2 | 141.2 | 4.4 | 156.9 | 59.1 | ||||||||||||||||||||||||||||||||||
| Fuels | 3 | 115.1 | 14.6 | 156.4 | -4.0 | ||||||||||||||||||||||||||||||||||
| Manufactured goods except food, beverages and tobacco | 5-9 | 157.7 | 6.3 | 99.3 | 5.2 | ||||||||||||||||||||||||||||||||||
| Exports | |||||||||||||||||||||||||||||||||||||||
| Total | 0-9 | 102.5 | 0.2 | 147.0 | 3.8 | ||||||||||||||||||||||||||||||||||
| Of which | |||||||||||||||||||||||||||||||||||||||
| Food, beverages and tobacco | 0-1 | 100.8 | 15.2 | 102.0 | -13.9 | ||||||||||||||||||||||||||||||||||
| Crude materials except fuels | 2 | 103.8 | -4.3 | 113.6 | 9.9 | ||||||||||||||||||||||||||||||||||
| Fuels | 3 | 90.3 | -3.9 | 167.6 | 1.3 | ||||||||||||||||||||||||||||||||||
| Manufactured goods except food, beverages and tobacco | 5-9 | 139.7 | 9.1 | 116.5 | 13.5 | ||||||||||||||||||||||||||||||||||
| Exports excl. crude oil and natural gas | 132.3 | 9.9 | 119.8 | 6.0 | |||||||||||||||||||||||||||||||||||
| 1 | Groups according to the Standard International Trade Classification (SITC-Rev. 3). |
Contact
-
Morten Madshus
E-mail: morten.madshus@ssb.no
tel.: (+47) 40 90 26 94
-
Mats Halvorsen
E-mail: mats.halvorsen@ssb.no
tel.: (+47) 40 90 24 33