Content
Published:
This is an archived release.
Import volume up in second quarter
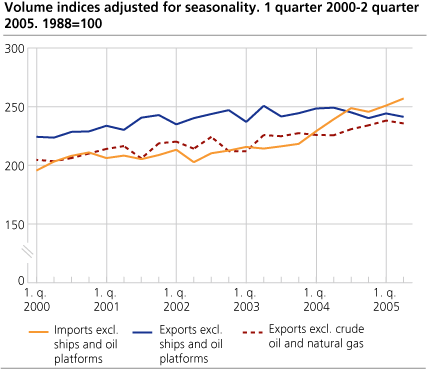
The import volume of traditional goods increased by 12.7 per cent in the second quarter of 2005 compared to the same quarter last year. The downward trend in fuels was offset by higher imports in the remaining groups. The increase was mainly due to higher imports of manufactured goods.
Higher imports of manufactured goods, up 14.8 per cent, was mainly due to higher imports of inorganic chemicals, machinery specialized for particular industries, office machines and automatic data processing machines as well as other transport equipment.
Seasonally adjusted figures also showed an upward trend in import volume, up 2.4 per cent from the first quarter this year. Compared with the increase of 2.1 per cent in the previous quarter this is a somewhat stronger increase. The fall in the import volume of fuels was mainly due to lower imports of electric current.
Higher exports of machinery
The export volume of traditional goods increased by 8.8 per cent from the second quarter of 2004 to the second quarter of 2005. As for imports the increase was mainly due to higher exports of manufactured goods, up 6.2 per cent, such as manufactures of metals, power generating machinery and equipment as well as telecom apparatus. Exports of food such as dairy products also increased, up 20 per cent. However, seasonally adjusted figures showed a decrease of 1.0 per cent compared with the first quarter this year.
Export prices still increasing
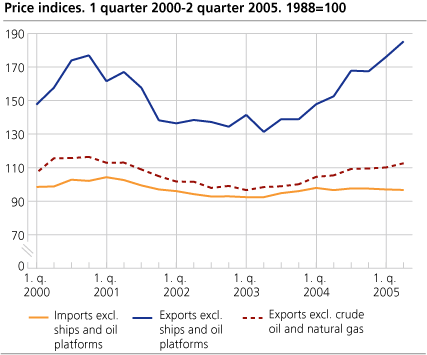
Export prices of goods excluding ships and oil platforms are still increasing. From the second quarter of 2004 prices increased by 21.4 per cent. As in the previous quarter higher prices on fuels contributed to the strong increase. In the second quarter of 2005 the increase was somewhat stronger, up 32.6 per cent. Prices of petroleum and petroleum products are higher, and so are prices of natural and manufactured gas, up 34 and 31 per cent respectively. The higher prices are also due to the international development in oil prices, with a record high level in June.
From the second quarter of 2004 to the second quarter of 2005 export prices of traditional goods increased as well, up 6.8 per cent. Export prices are higher in all groups despite the upward trend in the Norwegian exchange rate in the first six months of 2005.
Export prices of traditional goods increased by 2.3 per cent in the second quarter of 2005 compared to the first quarter of 2005. Prices are up for dairy products, fish and preparations thereof as well as manufactures of metals.
Minor increase in import prices
From the second quarter of 2004, the development in import prices showed a slight, upward trend. The minor increase of 0.1 per cent was mainly due to higher prices on petroleum and petroleum products as well as beverages and tobacco.
Import prices decreased by 0.3 per cent in the second quarter of 2005 compared to the first quarter this year. Lower prices of food were offset by higher prices of fuels.
| External trade in commodities excl. ships and oil platforms. Indices of price and volume. 2nd quarter 2005 |
| Commodity group1 | Commodity SITC | Volume | Price | ||||||||||||||||||||||||||||||||||||
|---|---|---|---|---|---|---|---|---|---|---|---|---|---|---|---|---|---|---|---|---|---|---|---|---|---|---|---|---|---|---|---|---|---|---|---|---|---|---|---|
| 2nd quarter 2005 |
2nd quarter
2004 and 2005. Change in per cent |
2nd quarter 2005 |
2nd quarter
2004 and 2005. Change in per cent |
||||||||||||||||||||||||||||||||||||
| Imports | |||||||||||||||||||||||||||||||||||||||
| Total | 0-9 | 269.8 | 12.7 | 96.7 | 0.1 | ||||||||||||||||||||||||||||||||||
| Of which | |||||||||||||||||||||||||||||||||||||||
| Food, beverages and tobacco | 0-1 | 210.2 | 9.8 | 126.5 | -0.1 | ||||||||||||||||||||||||||||||||||
| Crude materials except fuels | 2 | 297.0 | 14.1 | 88.5 | 0.7 | ||||||||||||||||||||||||||||||||||
| Fuels | 3 | 114.4 | -21.0 | 234.2 | 13.5 | ||||||||||||||||||||||||||||||||||
| Manufactured goods except food, beverages and tobacco | 5-9 | 283.3 | 14.8 | 91.7 | -0.5 | ||||||||||||||||||||||||||||||||||
| Exports | |||||||||||||||||||||||||||||||||||||||
| Total | 0-9 | 244.4 | 0.3 | 185.2 | 21.4 | ||||||||||||||||||||||||||||||||||
| Of which | |||||||||||||||||||||||||||||||||||||||
| Food, beverages and tobacco | 0-1 | 248.2 | 4.3 | 98.9 | 9.8 | ||||||||||||||||||||||||||||||||||
| Crude materials except fuels | 2 | 123.7 | 0.7 | 116.1 | 0.7 | ||||||||||||||||||||||||||||||||||
| Fuels | 3 | 266.9 | -2.7 | 301.7 | 32.6 | ||||||||||||||||||||||||||||||||||
| Manufactured goods except food, beverages and tobacco | 5-9 | 251.3 | 6.2 | 97.9 | 2.5 | ||||||||||||||||||||||||||||||||||
| Exports excl. crude oil and natural gas | 241.1 | 8.8 | 112.6 | 6.8 | |||||||||||||||||||||||||||||||||||
| 1 | Groups according to the Standard International Trade Classification (SITC-Rev. 3). |
Contact
-
Morten Madshus
E-mail: morten.madshus@ssb.no
tel.: (+47) 40 90 26 94
-
Mats Halvorsen
E-mail: mats.halvorsen@ssb.no
tel.: (+47) 40 90 24 33


