Content
Published:
This is an archived release.
Growing external trade in 2010
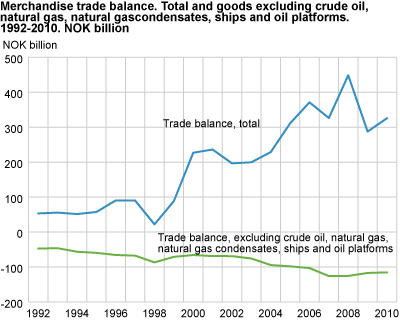
The Norwegian external trade in 2010 grew compared to 2009. Both imports and exports rose and reached the level of 2007, as did the trade balance. Nevertheless, the record year of 2008 still has last decade’s highest trade figures.
The total export value of 2010 reached NOK 792.6 billion, while the import of commodities amounted to NOK 466.8 billion. Consequently, the trade surplus came to NOK 325.8 billion. This was 13 per cent higher than in 2009, but 27 per cent lower than in 2008.
In 2010, exports accounted for 32 per cent of the gross national product. The share was 31 per cent in 2009 and 38 per cent the previous year. For the imports, the equivalent figures were 19 per cent in 2010, 18 per cent 2009 and 20 per cent a year earlier.
The exports increased by NOK 74.6 billion, representing a rise of 10.4 per cent compared to 2009. Growing oil and gas revenues accounted for close to NOK 50 billion of the rise. Mainland exports showed an increase for most main commodity groups, and for metals and fish in particular. The export of fish was the highest ever recorded.
Imports rose by NOK 36.4 billion, 8.5 per cent, compared to 2009. The growth is visible for most commodity groups. In particular, vehicles, metalliferous ores and electric current had a large upturn. The import of machinery, however, has not yet recovered from the financial crisis.
Higher oil price, reduction in production volumes
Compared to 2009, the average oil price rose by NOK 108 per barrel, ending at NOK 487 per barrel in 2010. This led to a 14 per cent increase in export values of crude oil, making the total value NOK 277.1 billion. The number of barrels exported has fallen continuously since the export peak of 2001. Exported volumes in 2010 amounted to 568.5 million barrels of crude oil, down by 11 per cent from last year, and nearly half of the volume in 2001.
Record high volumes of natural gas exported
A total of 97.4 billion Sm3(standard cubic metres) natural gas in gaseous state was exported in 2010; the highest amount ever recorded. This constituted an increase of 831 million Sm3, or 1 per cent, compared to 2009. Total export values ended at NOK 164 billion; up 11 per cent from last year, but 22 per cent lower than the record year 2008. The cause of this was fluctuations in the price of natural gas. The price was on average NOK 1.68 per cubic metre for 2010, compared to NOK 1.53 the year before. The largest recipient countries by value in 2010 were United Kingdom, Germany and France.
Growing metal exports while engineering products fell
The metal exports rose considerably last year following the drop in 2009. These amounted to NOK 60 billion, which is equal to a 31 per cent rise. However, this is still lower than the export value of the years 2006-2008. The increase was mainly due to higher prices. Alloys of aluminium, the most important product, increased by NOK 4.2 billion and amounted to NOK 20.4 billion. This was followed by unalloyed nickel, which went up by more than 50 per cent, to NOK 11.9 billion.
In 2010, the export of engineering products came to NOK 48.5 billion, which is a decline compared to 2008 and 2009 of 11 and 13 per cent respectively.
Parts of drilling machines were the single product with the highest export value; NOK 5.0 billion in 2010. However, this commodity together with machines and mechanical appliances with individual functions, and centrifugal pumps, which range second and third in value, experienced a fall in export value.
Another record year for fish exports
The export of fish continued to climb. The growth has been particularly high for the last two years. In 2010, the export amounted to NOK 52.3 billion compared to NOK 43.5 billion the year before and NOK 37.4 billion in 2008.
Our most important export product was fresh farmed bread salmon, which accounted for 44 per cent of the total export of fish last year. This was followed by fresh fillet of salmon, which rose by close to NOK 1 billion. Even though both commodities experienced an upturn in exported volume, it was the growth in prices that explained most of the increase.
Increase in export-related industries
The mining and extraction industry, in which the exports of crude oil and natural gas dominate completely, accounted for 57 per cent of the total export value. The export from this activity came to NOK 450.2 billion; an increase of 12.5 per cent compared to 2009.
Exports from the manufacturing industries accounted for 39 per cent of the total export. The increase was NOK 17.5 billion, or 6 per cent, compared to 2009. Refineries and basic metals have alternated places as the most important activity in the manufacturing industry in recent years. In 2010, metals came first.
Less imports of machinery, but more cars
In 2010, NOK 435 billion, or 93 per cent, of the total import came from the manufacturing industries. There was a general increase in value of 7 per cent from 2009, but not all activities showed growth.
Like previous years, machinery and equipment was the largest activity in 2010, amounting to NOK 52.2 billion, down 9 per cent from 2009. Chemicals came second with an import value of NOK 44.6 billion, in comparison to a rise of 9 per cent in the same period.
Consumption goods rose by 4 per cent and amounted to NOK 106.1 billion. Passenger motor cars had the largest percentual growth. The import value came to NOK 26.2 billion, which was 35 per cent higher than in 2009. Counted in numbers, the import reached 183 600 cars, which is an increase of 30 per cent.
Decreased exports to Asia
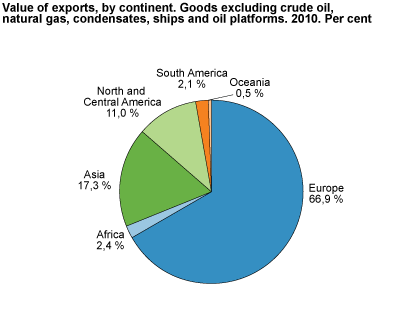
A geographical distribution of the Norwegian mainland export in 2010 showed an increase to all continents except Asia compared with 2009. When excluding crude oil, natural gas, condensates, ships and oil platforms, the total export value increased by NOK 28.7 billion or 9.4 per cent compared to 2009.
Exports to European countries accounted for two thirds of the total mainland exports in 2010, with a value of NOK 223.1 billion, compared with NOK 204.4 billion in 2009. Like the previous year, the main recipient countries were Sweden and Germany in 2010, with Norwegian exports worth NOK 35.6 billion and NOK 29.0 billion. When including the export of continental shelf commodities, the United Kingdom was the most important recipient of exports, as the British received Norwegian crude oil at an export value of NOK 137.2 billion in 2010.
Asia, with China in the lead, has been receiving an increasing amount of the mainland exports, although their share fell slightly in 2010. In 2010, Asian countries received 17.3 per cent of exports excluding crude oil, natural gas, condensates, ships and oil platforms, compared with 19.3 per cent in 2009. Both China and South Korea imported more Norwegian commodities in 2009 than last year, while Japan and Singapore received more commodities in 2010. The main goods exported to China were non-ferrous metals, machinery specialised for particular industries and fish, all with a value of approximately NOK 2 billion.
Mainland exports to North and Central America increased by 21.1 per cent compared with 2009. The dominating market, the USA, received goods worth NOK 31.8 billion in 2010. From 2009 to 2010, particularly exports of fish and non-ferrous metals increased.
Increased imports from all parts of the world
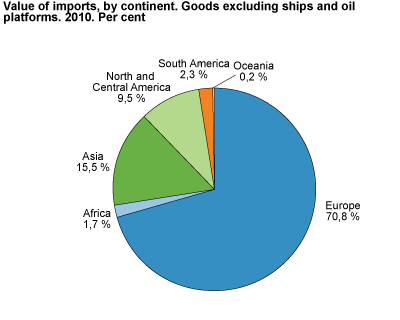
The import from all parts of the world rose in 2010 compared to 2009. Excluding ships and oil platforms, imports from European countries came to NOK 318.1 billion; an increase of 4.4 per cent. Imports from Asian countries also increased noticeably in 2010; 10.5 per cent up from 2009. Imports from North and Central America amounted to NOK 42.5 billion - an increase of 15.3 per cent.
The overall increase in shipments led to small changes in the structure of imports with respect to geographical distribution. European imports accounted for 70.8 per cent of the total value in 2010, relative to 72.2 in 2009. Imports from Asia increased from 14.9 in 2009 to 15.5 last year. North and Central America’s share also slightly increased from 8.7 per cent to 9.5 per cent.
Sweden was our biggest trading partner, also with respect to imports, with a value of NOK 65.6 billion in 2010. This is more than in 2009, but less than both 2007 and 2008. The main commodities coming from Sweden were petroleum products and cars.
After Sweden, we imported most commodities from Germany in 2010. These imports increased by 4.5 per cent from 2009, with road vehicles having the largest increase. Like the previous year, China was the third largest shipper of commodities to Norway in 2010, with an increase of 17.4 per cent. China is one of the few countries with increased exports to Norway in the last three years. Most countries had higher exports to Norway in both 2007 and 2008.
More imports also from developing countries
Imports from developing countries came to NOK 77.3 billion in 2010. This is NOK 9.4 billion or 13.9 per cent up from 2009. Imports from these countries increased greatly up to 2008, before decreasing in 2009. An improvement in the general financial situation has again led to increasing exports from these countries to Norway.
Imports from countries with preferential treatment (according to the GSP agreement, see appendix for more information ) went up NOK 9.7 billion to NOK 71.7 billion in 2010. Of total imports, the share of dutiable imports affected by GSP reached NOK 12.5 billion, of which NOK 7.9 billion was eligible for GSP treatment. However, only NOK 6.5 billion was agreed as GSP treatment.
Imports from the least developed countries (LDC) fell by NOK 650 million, to NOK 5.1 billion in 2010.
Appendix. See also: General comments to the tables and figures .
Tables and charts
The statistics is published with External trade in goods.
Contact
-
Statistics Norway's Information Centre
E-mail: informasjon@ssb.no
tel.: (+47) 21 09 46 42


