Content
Published:
This is an archived release.
Oil and gas prices gave record surplus
The trade surplus in 2008 was the highest ever registered. This year had several records, both for exports of oil, natural gas and fish. The difficult situation in the world economy towards the end of 2008 was partly reflected in lower metal prices and a decline in imports of passenger cars.
In 2008, the trade surplus came to NOK 460.5 billion, up NOK 134.1 billion from 2007. The exports value of commodities reached NOK 957.8 billion, and imports ended at NOK 497.4 billion. Both the value for exports and imports show a positive development compared with 2007.
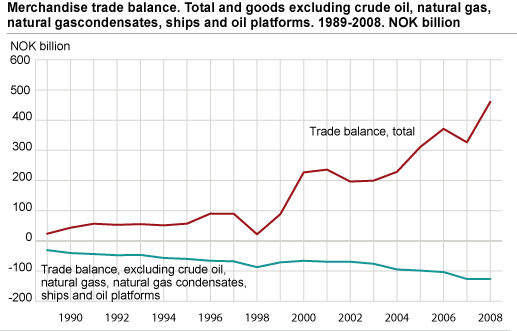
The surplus of the trade balance at NOK 460.5 billion is the highest ever registered. The trade surplus grew 41.0 per cent from 2007, which was the highest climb since the year 2000. The growth in exports increased more than 20 per cent from 2007, and is mainly due to increased oil and gas revenues.
The growth in imports however, was lower in 2008 than in previous years. In 2008, imports only increased by 6.1 per cent, less than half of the two previous years, when the increase was 13.9 and 15.1 respectively.
Record high crude oil price, but less exported barrels
In 2008, the Norwegian export value of crude oil amounted to NOK 359.4 billion, an increase of NOK 49.7 billion from 2007. In total, the average crude oil price increased from NOK 426 to NOK 539 per barrel. The high crude oil price was record high from January to July in 2008. However, towards the end of the year the crude oil prices fell dramatically, and dropped to less than NOK 300 per barrel in December. Despite the lowest exported quantum of crude oil since 1991, the record high crude oil price secured a record year for export revenues from the crude oil.
The number of exported barrels declined NOK 59.6 million barrels (8.2 per cent) compared to the previous year. In 2008, we exported 666.5 million barrels of crude oil, of which 528.6 million barrels were stabilised crude oil shipped from installations on the Continental Shelf and onshore terminals (Mongstad and Sture). The remaining 137.9 5 million barrels were unstabilised crude oil, transported by pipelines to the Norwegian-owned terminals in the UK (Teesside and Sullom Voe) for separation and fractionating into stabilised crude oil and NGL.
Record high exports of natural gas
The export value of natural gas in 2008 came to NOK 218.1 billion, an increase of NOK 134.8 billion from 2007. This value includes natural gas both in liquid and gaseous state, where the latter amounts to most of the value. The exported quantum of natural gas went up by 8.9 billion Sm3 (standard cubic metres), or 10.4 per cent. Total exported quantum reached 94.6 billion Sm3 and a value of NOK 214.4 billion in 2008, the highest ever recorded. The exported quantum of natural gas has increased every year since 1994. Natural gas prices in 2008 increased NOK 0.70 per unit, ending at NOK 2.27 per Sm3. In large parts of 2008, prices for natural gas exceeded NOK 2.0 per Sm3, and during the last quarter were close to NOK 3.0 per Sm3. This is the highest price registered so far, pushing the revenues from natural gas exports up.
Increased exports of engineering products and metals
Total exports of engineering products came to NOK 54.3 billion in 2008, up NOK 9.7 billion or 21.6 per cent compared with 2007. The increase in value for this commodity group was mainly caused by an increased volume.
No commodity stands out among the selected commodities. However, parts of drilling machines had the highest export value with NOK 3.6 billion in 2008, a small increase of NOK 203 million from 2007. This was followed by exports of centrifugal pumps and machines with individual functions by NOK 3.5 and 2.8 billion respectively. Exports of the last two commodities increased by about NOK 500 million in 2008.
The increase in exports of engineering products was also aided by a lump export of instruments for distillation in 2008, up from NOK 17 million in 2007, to NOK 1.8 billion in 2008. Exports of parts for arms and ammunition increased by NOK 770 million, and reached NOK 1.9 billion. Also exports of filters and pumps for air or gas compressors and fans increased NOK 980 million, ending at NOK 1.1 billion.
Exports of metals came to NOK 70.2 billion in 2008, down NOK 8.5 billion from the previous year. The decrease in 2008 was caused by a strong decline in prices, while the volume remained the same as in 2007. Among commodities that declined, we find unalloyed nickel, down NOK 8.9 billion, and alloys of aluminium, down NOK 2 billion. The prices fell particularly in the last months of 2008.
Fourth year in a row with record high fish exports
Exports of fish reached NOK 37.4 billion in 2008, about NOK 1.7 billion more than in 2007. When we include foreign fish stored in customs warehouses and re-exported, total exports amounted to NOK 38.4 billion.
The main contributor to the record levels of fish exports in 2008 was high exports of famed bread salmon (fresh or chilled), with an increase of NOK 746 million. The average price for 2008 increased by NOK 0.48, ending at NOK 26.94. The volume increased by 18 887 tonnes. Herring and mackerel also increased by NOK 293 and 347 million respectively. Price per kilo of herring fell marginally - by NOK 0.20, while the price for mackerel climbed NOK 2.62 per kilo.
Exports of fish showed a powerful increase in the last months of 2008, and therefore were not affected much by the financial crisis in 2008.
Mining and extraction the largest export activity
Groups based by activity and commodity numbers show exports of mining and extraction have the highest exported value; about 61 per cent of the total exported value in 2008. Exports of crude oil and natural gas are the dominating commodities, and amount to 98.9 per cent of the total value from this activity.
Exported value from the manufacturing industries reached NOK 343.3 billion, or 35.8 per cent of the total exported value. Refineries and basic metals have alternated places as the most important commodity group in the manufacturing industry sector in recent years. In 2008, refineries came to NOK 75.1 billion, while basic metals reached NOK 70.2 billion.
For imports, the manufacturing industries are the most important activity with NOK 470.8 billion, or 94.7 per cent of the total imported value. For this activity, machinery and equipment was the largest group in 2008 amounting to NOK 68.4 billion. This commodity group was the largest in the period from 2003 to 2008. In second place we find basic metals which reached NOK 51.8 billion. Motor vehicles and chemicals came to NOK 43.6 and 43.1 billion respectively. Other transport equipment (aeroplanes, ships and smaller boats) amounted to nearly NOK 38.0 billion. Imports of other transport equipment increased by NOK 9.6 billion, mostly due to imports of aeroplanes and ships. Changes in these figures vary quite a lot from one year to another.
Increase in exports of fuels and lubricants
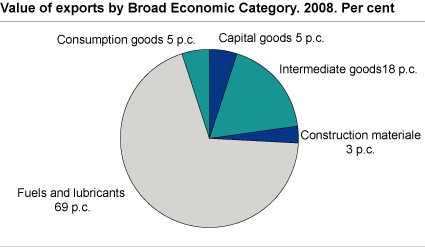
Exports of goods by broad economic category show an increase for fuels and lubricants, and also a small increase for capital goods in 2008.
Fuels and lubricants, among others, also include other fuels and lubricants, motor gasoline and diesel. The total exports of these commodities reached NOK 662.1 billion. This amounted to 69.1 per cent of the Norwegian exports in 2008. The corresponding share in 2007 was 64.5 per cent. As mentioned above, the increase is mainly due to record high prices for crude oil and natural gas.
Exports of capital goods came to NOK 47.6 billion, a share of 5.0 per cent in 2008, unchanged from 2007. Exports of transport equipment excluding passenger cars increased 20.4 per cent to NOK 13.6 billion in 2008. As mentioned earlier, these figures normally vary from one year to another. Other capital goods climbed 19.3 per cent from 2007 and reached NOK 34.0 billion.
Car imports down by 35 000
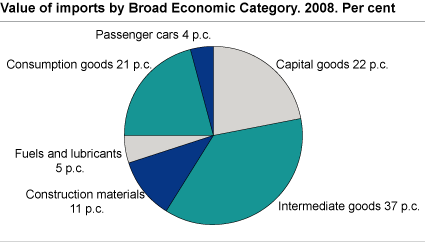
Imports of goods by broad economic category showed an increase in capital goods in 2008. The import value for this group reached NOK 110.4 billion, up 15.7 per cent from 2007. This group of commodities shows a continuous increase in the last five years. It is mainly the category capital goods other than transport equipment that contributed to the growth.
Imports of passenger cars fell both in value and number in 2008. The import value of passenger cars came to NOK 21.9 billion in 2008, a decline of 16.1 per cent from 2007 when the corresponding imports reached NOK 26.1 billion. The financial crisis influenced the imports of cars in the last months of 2008, and the number fell by 35 000 passenger cars from 2007 to 2008. We imported 13 600 fewer cars from Germany in 2008.
European countries - our most important trade partners
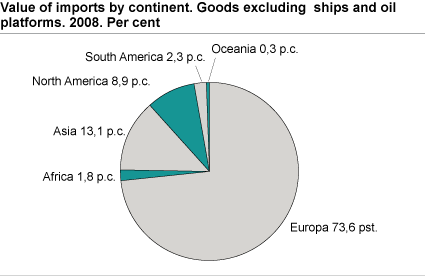
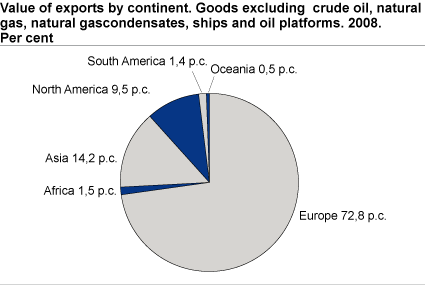
In 2008, a total of 72.8 per cent of exports of goods excluding crude oil, natural gas, condensates, ships and oil platforms went to Europe. Germany and Sweden are our two largest recipient countries of these commodities. However if we include exports of all goods, United Kingdom and Germany are our largest recipient countries.
Exports to Asia (excluding crude oil, natural gas, condensates, ships and oil platforms) accounted for NOK 51.0 billion. This is a share of 14.2 per cent, an increase compared to 12.4 per cent in 2007. Imports (excluding ships and oil platforms) from Asia accounted for NOK 63.3 billion or 13.1 per cent, a slight increase from 12.9 per cent in 2007. From countries in Asia, we import the most from China and second most from Japan. Imports from China amounted to almost half the total imports from Asia, as in 2007.
Exports to North and Central America accounted for NOK 34.2 billion or 9.5 per cent, slightly down from 11.0 per cent in 2007. Imports from North and Central America amounted to NOK 42.9 billion in 2008, down from 2007. Trade with USA and Canada constitutes the better part of the trade with this continent.
Higher imports from developing countries
Imports from developing countries came to NOK 71.3 billion in 2008. This is an increase of NOK 10.3 billion or 17 per cent from 2007. Both imports and exports of goods have increased considerably in 2007 and 2008. This is due to a general increase in imports and exports, which has also affected trade with developing countries. The share of imports excluding ships and oil platforms increased marginally in 2008 ending at 14.3 per cent. In 2007, the corresponding share was 13.0 per cent.
Imports from countries with preferential treatment (according to the GSP agreement, see appendix for more information ) rose by NOK 8.7 billion to NOK 66.0 billion in 2008. Of total imports, the share of dutiable imports affected by GSP reached NOK 10.0 billion, of which NOK 7.2 billion was eligible for GSP treatment. However, only NOK 5.3 billion was agreed as GSP treatment.
Imports from the least developed countries (LDC) have increased by NOK 1.6 billion, to NOK 6.5 billion in 2008. Increased imports from Angola and Botswana of NOK 896 and 206 million respectively contributed to this growth.
Tables
General comments to the tables and figures (2008)Open and readClose
The main content of this report has already been published as preliminary figures. Nevertheless, some of the tables contain figures that have not been published previously. These are tables 25-28 concerning exports of fish, tables 29-30 concerning exports of engineering products and metals, tables 31-32 concerning exports and imports by two-digit activity and tables 35-37 concerning imports from developing countries.
The tables and figures contain statistics grouped by the main commodity classifications for goods in external trade, the SITC (the UN Standard International Trade Classification) and the HS (the international combined customs and statistical nomenclature). The tables are time series and cover the period 2003 to 2008. However, some cover a shorter period, while the table for crude oil and natural gas dates back to 1976. Moreover, figures 1-4 cover the period 1989 to 2008, figures 5 and 6 the period 1994 to 2008, while the rest of the figures only cover 2008.
Main figures
Tables 1-4 contain main figures for Norway’s external trade. The external trade excluding ships and oil platforms (table 3 and 4) corresponds to the format of the monthly articles on Statistics Norway's website. Main figures by broad economic category (BEC) are presented in tables 5-8.
Time series by SITC and HS
Tables 9-12 provide results for two-digit SITC aggregates, whereas figures by HS chapter are found in tables 13 to 16.
Trade by area
The Norwegian external trade by trade area, continent and partner country is shown in tables 17 and 18, imports by country of origin and exports by country of destination. All countries are included and grouped by continent. The trade areas are defined according to their delimitation in 2008. On the other hand, the annual figures for trade with individual countries reflect the country’s status in each year. As an example, see Yugoslavia and Serbia and Montenegro. This principle also applies to table 22, the most extensive table in the publication, which covers imports and exports by partner country, by two-digit SITC commodity groups. Commodity groups are specified on the basis of a cut-off defined as imports and/or exports of goods of a minimum of NOK 1 million in at least one of the three years in the table, 2006-2008.
Time series at detailed commodity levels
Selected external trade areas are presented in more detail in tables 23-44, highlighting some commodity flows and serving as examples of time series at detailed commodity levels. There are tables on imports of food, exports of fish and fish products, engineering products and metals, exports and imports by activity, exports and imports of ICT goods, imports from developing countries and exports of crude oil and natural gas. The tables on imports of foodstuff and exports of fish list commodities by value in 2008, at detailed, eight-digit commodity level (with some adaptations necessitated by changes in the nomenclature during the years).
Tables 24-30 are examples of external trade statistics at the most detailed commodity levels, eight-digit national nomenclature (in accordance with the HS) and five-digit SITC. The Norwegian commodity texts used are short versions of the complete texts.
Engineering products and metals
Exports of engineering products (table 29) and metals (table 30) correspond to the aggregates used for analytical purposes in trends of trade published in the Economic Survey. This implies that the total value for exports of metals in table 30 will be different from the figures put forward in table 11. Exports of commodities (table 31) and imports of commodities (table 32) are grouped by activity. In these tables, the commodity data are connected to industry by using an international activity/product grouping, i.e. the figures refer to the activity of the commodity and not necessarily the activity of the importing or exporting company.
Developing countries
With regard to imports from developing countries under the Generalised System of Preferences (GSP), a main point of interest may be to what extent the entitlement to preferential treatment is actually utilised. Since 1991, free trade agreements have been established between EFTA (and thereby Norway) and several of the former GSP countries. Consequently, the number of GSP countries has fallen. The range of eligible commodities has also been reduced due to the fact that more commodities are duty free.
Tables 35 and 36 shows the main features and development in Norwegian imports from developing countries, both total figures and according to the GSP. Table 37 shows import figures from some of the most important individual GSP/LDC partner countries.
From 2008, the OECD DAC list in force (this is an approved list of countries authorised and recognised as receivers of public development aid) forms the basis for which countries will be included in the Norwegian GSP system. In addition to the countries defined as LDC countries according to the OECD, Norway has also decided to give LDC treatment to low income countries with a population of less than 75 million people. Besides this, Botswana and Namibia have retained an approximate LDC treatment. As a consequence of this, the total figures for LDC countries in tables 35 and 36 will include figures for these other groups of countries and not only LDC countries as defined by the OECD.
LDC treatment within the GSP system implies duty and quota free market access to the Norwegian, while GSP treatment involves some more restrictions. For information concerning countries that are considered to be LDC countries, and which countries that are eligible to GSP treatment, please see the website of the Norwegian Customs.
Crude oil and natural gas
The unstabilised crude oil transported by pipeline from the Ekofisk Centre to Teesside is recorded as exports to the UK, along with the Norwegian share of the crude oil from the British oil field Murchison to Sullom Voe. Following separation into stabilised crude oil and natural gas liquids (NGL), some is shipped back to Norway and included as imports from the UK. As a supplement to the official Norwegian export statistics, tables 42 and 43 show the final distribution by country of the shipments of stabilised crude oil and NGL out of Teesside and Sullom Voe. Table 44 shows the partner country distribution of the aggregate of all shipments of Norwegian crude oil directly from the oil fields and from terminals in Norway and the UK. Only natural gas in gaseous state is included in tables 38 and 41. The total export of gas also contains liquid gas. This type of natural gas makes it possible to transport these types of goods by ship and to transport it to other parts of the world, not only by pipelines (gas in a gaseous state) to Europe.
The statistics is published with External trade in goods.
Contact
-
Statistics Norway's Information Centre
E-mail: informasjon@ssb.no
tel.: (+47) 21 09 46 42