Content
Published:
This is an archived release.
Strong increase in net foreign assets
Norway’s net foreign assets increased from NOK 104 billion in 1998 to NOK 1 332 billion in 2006. This development is reflected in the foreign investment of the Government Pension Fund - Global, which increased from NOK 172 to NOK 1 784 billion in the same period.
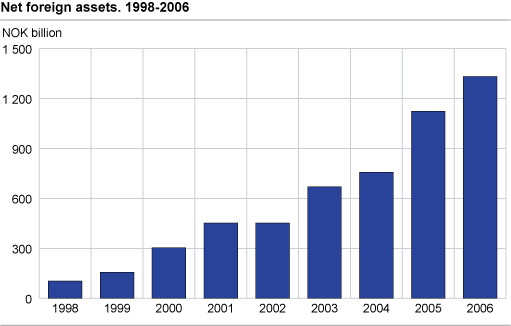
Between 1998 and 2006 Norway’s net foreign assets increased from NOK 104 billion to NOK 1 332 billion. In the same period, the foreign investment of the Government Pension Fund - Global increased from NOK 172 billion to NOK 1 784 billion. This means that the rest of the Norwegian economy experienced a growth in net liabilities of NOK 378 billion. The major part of this increase is in non-residents portfolio investment in Norway. In 2006, net foreign assets corresponded to 62 per cent of GDP compared with only 9 per cent in 1998.
Norway’s foreign assets
Total assets increased from NOK 955 billion to NOK 4 989 billion from 1998 to 2006. Norway invested mostly in portfolio investments such as foreign debt securities, equity and investment fund shares. There were also considerable placements in "other investments" such as loans, bank deposits and trade credits.
Norway’s foreign liabilities
Total liabilities increased from NOK 851 billion to NOK 3 657 billion in the same period. A substantial part of the liabilities are placements in "other investments", mainly as loans and trade credits. Norway also has considerable portfolio debt as debt securities, equities and shares.
| 1998 | 1999 | 2000 | 2001 | 2002 | 2003 | 2004 | 2005 | 2006 | |||||||||||||||||||||||||||||||
|---|---|---|---|---|---|---|---|---|---|---|---|---|---|---|---|---|---|---|---|---|---|---|---|---|---|---|---|---|---|---|---|---|---|---|---|---|---|---|---|
| Assets | 955 | 1 217 | 1 712 | 1 897 | 1 968 | 2 471 | 3 016 | 3 849 | 4 989 | ||||||||||||||||||||||||||||||
| Liabilities | 851 | 1 060 | 1 408 | 1 443 | 1 515 | 1 801 | 2 259 | 2 726 | 3 657 | ||||||||||||||||||||||||||||||
| Net assets | 104 | 157 | 304 | 453 | 453 | 670 | 757 | 1 123 | 1 332 | ||||||||||||||||||||||||||||||
| Net foreign assets in per cent of GDP | 9 | 13 | 21 | 29 | 30 | 42 | 43 | 58 | 62 | ||||||||||||||||||||||||||||||
International investment position
The international investment position (IIP) shows the stocks of external financial assets and liabilities. The IIP was introduced in the mid 1990s by the International Monetary Fund and is one of several statistics developed to improve the quality and availability of international economic statistics. The IIP statistics are based on the same principles and definitions as the financial account of the balance of payments (BoP). This implies that changes in the IIP stock in principle should be consistent with transactions, valuation changes and other adjustments in the financial account of the balance of payments. However, the use of different sources and production processes may result in deviations between the two sets of statistics. The IIP is primarily classified by function, i.e. direct investment, portfolio investment, other investment and reserve assets. The IIP and BoP use the directional principle for claims/liabilities that represent direct investment within in the same groups of companies, which means that claims/liabilities in this context are netted in the IIP and the BoP.
Tables:
The statistics is now published as International accounts.
Additional information
The International Investment Position (IIP) is the balance sheet of the stock of external financial assets and liabilities.
Contact
-
Statistics Norway's Information Centre
E-mail: informasjon@ssb.no
tel.: (+47) 21 09 46 42